
|
Commerce Bancshares, Inc. (CBSH) Évaluation DCF |
Entièrement Modifiable: Adapté À Vos Besoins Dans Excel Ou Sheets
Conception Professionnelle: Modèles Fiables Et Conformes Aux Normes Du Secteur
Pré-Construits Pour Une Utilisation Rapide Et Efficace
Compatible MAC/PC, entièrement débloqué
Aucune Expertise N'Est Requise; Facile À Suivre
Commerce Bancshares, Inc. (CBSH) Bundle
Gagnez du temps et améliorez la précision avec notre calculatrice DCF (CBSH)! En utilisant des données Real Commerce Bancshares, Inc. et des hypothèses modifiables, cet outil vous permet de prévoir, analyser et valoriser le commerce Bancshares, Inc. comme un investisseur chevronné.
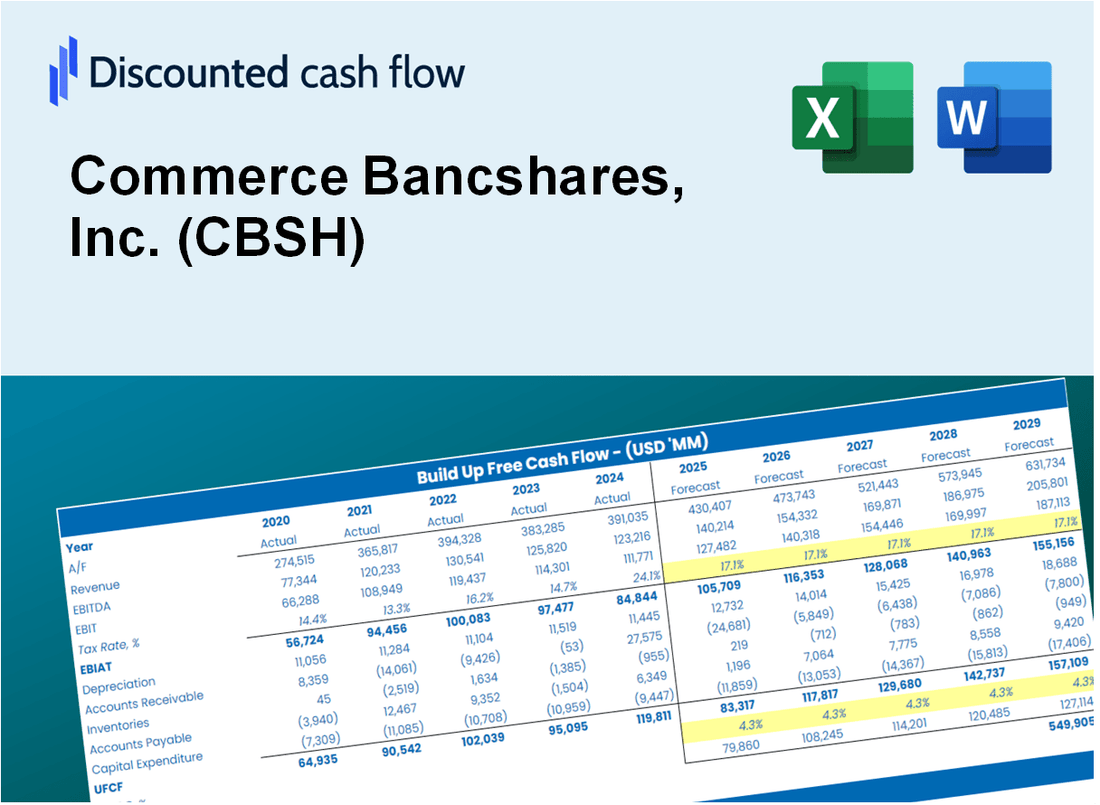
Discounted Cash Flow (DCF) - (USD MM)
| Year | AY1 2020 |
AY2 2021 |
AY3 2022 |
AY4 2023 |
AY5 2024 |
FY1 2025 |
FY2 2026 |
FY3 2027 |
FY4 2028 |
FY5 2029 |
|---|---|---|---|---|---|---|---|---|---|---|
| Revenue | 1,389.5 | 1,438.7 | 1,566.0 | 1,969.3 | 2,092.9 | 2,325.3 | 2,583.5 | 2,870.4 | 3,189.2 | 3,543.3 |
| Revenue Growth, % | 0 | 3.54 | 8.85 | 25.75 | 6.28 | 11.1 | 11.1 | 11.1 | 11.1 | 11.1 |
| EBITDA | 484.9 | 731.2 | 679.2 | 669.2 | 733.6 | 921.4 | 1,023.7 | 1,137.4 | 1,263.7 | 1,404.0 |
| EBITDA, % | 34.9 | 50.82 | 43.37 | 33.98 | 35.05 | 39.63 | 39.63 | 39.63 | 39.63 | 39.63 |
| Depreciation | 43.8 | 44.9 | 46.9 | 49.5 | 54.1 | 66.8 | 74.2 | 82.4 | 91.6 | 101.8 |
| Depreciation, % | 3.15 | 3.12 | 2.99 | 2.51 | 2.58 | 2.87 | 2.87 | 2.87 | 2.87 | 2.87 |
| EBIT | 441.2 | 686.3 | 632.4 | 619.7 | 679.5 | 854.6 | 949.5 | 1,055.0 | 1,172.1 | 1,302.3 |
| EBIT, % | 31.75 | 47.7 | 40.38 | 31.47 | 32.47 | 36.75 | 36.75 | 36.75 | 36.75 | 36.75 |
| Total Cash | 14,634.2 | 18,726.8 | 13,080.0 | 12,366.9 | 12,509.8 | 2,325.3 | 2,583.5 | 2,870.4 | 3,189.2 | 3,543.3 |
| Total Cash, percent | .0 | .0 | .0 | .0 | .0 | .0 | .0 | .0 | .0 | .0 |
| Account Receivables | .0 | .0 | .0 | .0 | .0 | .0 | .0 | .0 | .0 | .0 |
| Account Receivables, % | 0 | 0 | 0 | 0 | 0 | 0 | 0 | 0 | 0 | 0 |
| Inventories | .0 | .0 | .0 | .0 | .0 | .0 | .0 | .0 | .0 | .0 |
| Inventories, % | 0 | 0 | 0 | 0 | 0 | 0 | 0 | 0 | 0 | 0 |
| Accounts Payable | .0 | .0 | .0 | .0 | .0 | .0 | .0 | .0 | .0 | .0 |
| Accounts Payable, % | 0 | 0 | 0 | 0 | 0 | 0 | 0 | 0 | 0 | 0 |
| Capital Expenditure | -33.1 | -56.7 | -65.2 | -88.1 | -46.1 | -79.8 | -88.7 | -98.5 | -109.5 | -121.6 |
| Capital Expenditure, % | -2.38 | -3.94 | -4.16 | -4.47 | -2.2 | -3.43 | -3.43 | -3.43 | -3.43 | -3.43 |
| Tax Rate, % | 22.54 | 22.54 | 22.54 | 22.54 | 22.54 | 22.54 | 22.54 | 22.54 | 22.54 | 22.54 |
| EBITAT | 354.1 | 530.8 | 488.4 | 477.1 | 526.3 | 665.4 | 739.2 | 821.3 | 912.5 | 1,013.9 |
| Depreciation | ||||||||||
| Changes in Account Receivables | ||||||||||
| Changes in Inventories | ||||||||||
| Changes in Accounts Payable | ||||||||||
| Capital Expenditure | ||||||||||
| UFCF | 364.7 | 518.9 | 470.1 | 438.5 | 534.3 | 652.3 | 724.7 | 805.2 | 894.6 | 994.0 |
| WACC, % | 8.13 | 8 | 8 | 7.99 | 8.01 | 8.02 | 8.02 | 8.02 | 8.02 | 8.02 |
| PV UFCF | ||||||||||
| SUM PV UFCF | 3,196.4 | |||||||||
| Long Term Growth Rate, % | 2.00 | |||||||||
| Free cash flow (T + 1) | 1,014 | |||||||||
| Terminal Value | 16,829 | |||||||||
| Present Terminal Value | 11,441 | |||||||||
| Enterprise Value | 14,637 | |||||||||
| Net Debt | -446 | |||||||||
| Equity Value | 15,083 | |||||||||
| Diluted Shares Outstanding, MM | 134 | |||||||||
| Equity Value Per Share | 112.23 |
What You Will Get
- Editable Forecast Inputs: Easily modify assumptions (growth %, margins, WACC) to develop various scenarios.
- Real-World Data: Commerce Bancshares, Inc.'s (CBSH) financial data pre-filled to kickstart your analysis.
- Automatic DCF Outputs: The template computes Net Present Value (NPV) and intrinsic value for you.
- Customizable and Professional: A refined Excel model that adjusts to your valuation requirements.
- Built for Analysts and Investors: Perfect for evaluating projections, validating strategies, and enhancing efficiency.
Key Features
- Real-Life CBSH Data: Pre-filled with Commerce Bancshares' historical financials and future projections.
- Fully Customizable Inputs: Modify revenue growth, margins, WACC, tax rates, and capital expenditures as needed.
- Dynamic Valuation Model: Automatic updates to Net Present Value (NPV) and intrinsic value based on your adjustments.
- Scenario Testing: Develop multiple forecasting scenarios to evaluate various valuation results.
- User-Friendly Design: Intuitive, organized, and suitable for both professionals and newcomers.
How It Works
- Step 1: Download the Excel file.
- Step 2: Review pre-entered Commerce Bancshares, Inc. (CBSH) data (historical and projected).
- Step 3: Adjust key assumptions (yellow cells) based on your analysis.
- Step 4: View automatic recalculations for Commerce Bancshares, Inc. (CBSH)'s intrinsic value.
- Step 5: Use the outputs for investment decisions or reporting.
Why Choose This Calculator for Commerce Bancshares, Inc. (CBSH)?
- All-in-One Solution: Features DCF, WACC, and financial ratio analyses tailored for CBSH.
- Flexible Parameters: Modify yellow-highlighted cells to explore different financial scenarios.
- In-Depth Analysis: Automatically computes the intrinsic value and Net Present Value for Commerce Bancshares, Inc. (CBSH).
- Ready-to-Use Data: Includes historical and projected data for reliable analysis.
- Expert-Level Tool: Perfect for financial analysts, investors, and business consultants focused on CBSH.
Who Should Use This Product?
- Investors: Accurately assess Commerce Bancshares, Inc.'s (CBSH) fair value prior to making investment choices.
- CFOs: Utilize a high-quality DCF model for financial reporting and strategic analysis.
- Consultants: Efficiently modify the template for client valuation reports.
- Entrepreneurs: Acquire knowledge of financial modeling techniques employed by leading banks.
- Educators: Implement it as an educational resource to illustrate valuation methods.
What the Template Contains
- Comprehensive DCF Model: Editable template featuring detailed valuation calculations tailored for Commerce Bancshares, Inc. (CBSH).
- Real-World Data: Commerce Bancshares’ historical and projected financials preloaded for in-depth analysis.
- Customizable Parameters: Modify WACC, growth rates, and tax assumptions to explore various scenarios.
- Financial Statements: Complete annual and quarterly breakdowns for enhanced insights into performance.
- Key Ratios: Integrated analysis for assessing profitability, efficiency, and leverage metrics.
- Dashboard with Visual Outputs: Engaging charts and tables to present clear, actionable results.
Disclaimer
All information, articles, and product details provided on this website are for general informational and educational purposes only. We do not claim any ownership over, nor do we intend to infringe upon, any trademarks, copyrights, logos, brand names, or other intellectual property mentioned or depicted on this site. Such intellectual property remains the property of its respective owners, and any references here are made solely for identification or informational purposes, without implying any affiliation, endorsement, or partnership.
We make no representations or warranties, express or implied, regarding the accuracy, completeness, or suitability of any content or products presented. Nothing on this website should be construed as legal, tax, investment, financial, medical, or other professional advice. In addition, no part of this site—including articles or product references—constitutes a solicitation, recommendation, endorsement, advertisement, or offer to buy or sell any securities, franchises, or other financial instruments, particularly in jurisdictions where such activity would be unlawful.
All content is of a general nature and may not address the specific circumstances of any individual or entity. It is not a substitute for professional advice or services. Any actions you take based on the information provided here are strictly at your own risk. You accept full responsibility for any decisions or outcomes arising from your use of this website and agree to release us from any liability in connection with your use of, or reliance upon, the content or products found herein.