
|
ENI S.P.A. (E) Évaluation DCF |
Entièrement Modifiable: Adapté À Vos Besoins Dans Excel Ou Sheets
Conception Professionnelle: Modèles Fiables Et Conformes Aux Normes Du Secteur
Pré-Construits Pour Une Utilisation Rapide Et Efficace
Compatible MAC/PC, entièrement débloqué
Aucune Expertise N'Est Requise; Facile À Suivre
Eni S.p.A. (E) Bundle
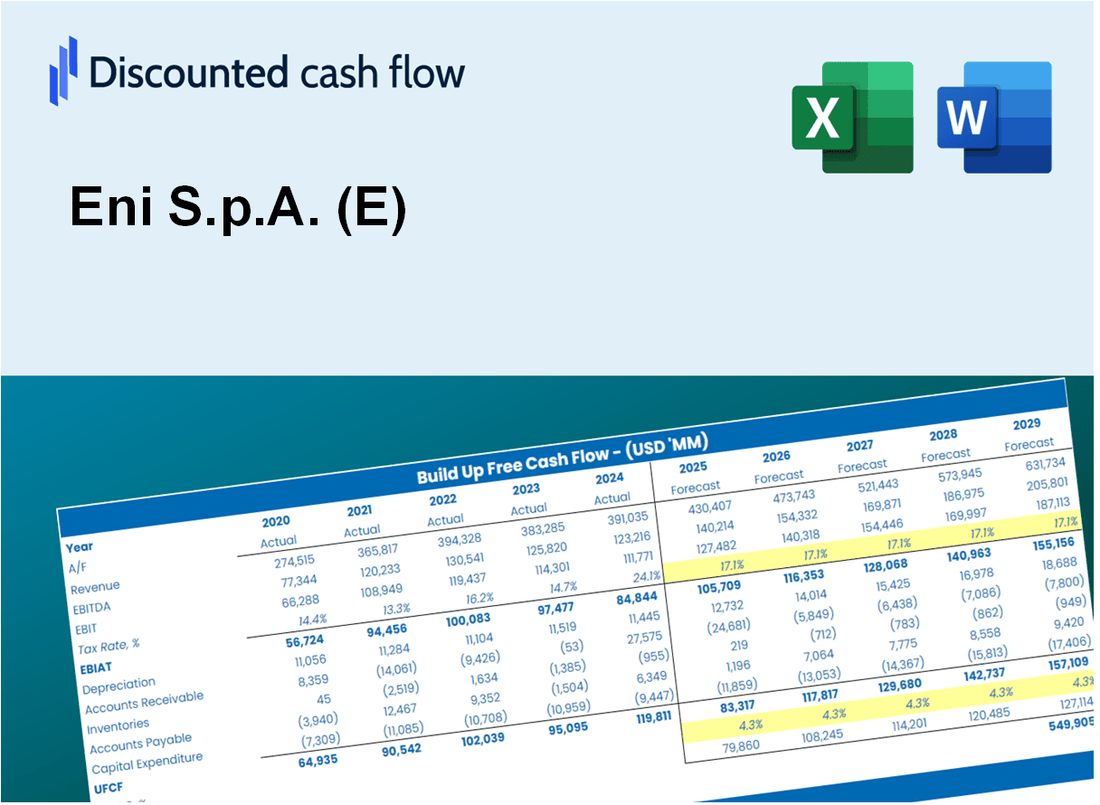
Conçu pour la précision, notre calculatrice ENI S.P.A. (E) DCF vous permet d'évaluer l'évaluation ENI S.P.A. à l'aide de données financières réelles, offrant une flexibilité complète pour modifier tous les paramètres clés pour des projections améliorées.
What You Will Get
- Editable Forecast Inputs: Easily modify key assumptions (growth %, margins, WACC) to explore various scenarios.
- Real-World Data: Eni S.p.A.'s financial data pre-loaded to facilitate your analysis.
- Automatic DCF Outputs: The template computes Net Present Value (NPV) and intrinsic value automatically.
- Customizable and Professional: A refined Excel model that can be tailored to your valuation requirements.
- Built for Analysts and Investors: Perfect for evaluating projections, confirming strategies, and enhancing efficiency.
Key Features
- 🔍 Real-Life Eni Financials: Pre-filled historical and projected data for Eni S.p.A. (E).
- ✏️ Fully Customizable Inputs: Adjust all critical parameters (yellow cells) like WACC, growth %, and tax rates.
- 📊 Professional DCF Valuation: Built-in formulas calculate Eni’s intrinsic value using the Discounted Cash Flow method.
- ⚡ Instant Results: Visualize Eni’s valuation instantly after making changes.
- Scenario Analysis: Test and compare outcomes for various financial assumptions side-by-side.
How It Works
- Download: Get the pre-formatted Excel file containing Eni S.p.A.'s (E) financial data.
- Customize: Modify projections, such as revenue growth, EBITDA %, and WACC.
- Update Automatically: The intrinsic value and NPV calculations refresh in real-time.
- Test Scenarios: Develop various forecasts and evaluate results immediately.
- Make Decisions: Leverage the valuation outcomes to inform your investment strategy.
Why Choose This Calculator for Eni S.p.A. (E)?
- All-in-One Tool: Features DCF, WACC, and financial ratio analyses tailored for Eni S.p.A. (E).
- Adjustable Parameters: Modify yellow-highlighted cells to explore different financial scenarios.
- In-Depth Analysis: Automatically computes Eni S.p.A.'s intrinsic value and Net Present Value.
- Preloaded Information: Historical and projected data provide reliable starting points for analysis.
- High Professional Standards: Perfect for financial analysts, investors, and business consultants focusing on Eni S.p.A. (E).
Who Should Use This Product?
- Individual Investors: Make informed decisions about buying or selling Eni S.p.A. (E) stock.
- Financial Analysts: Streamline valuation processes with ready-to-use financial models for Eni S.p.A. (E).
- Consultants: Deliver professional valuation insights on Eni S.p.A. (E) to clients quickly and accurately.
- Business Owners: Understand how major companies like Eni S.p.A. (E) are valued to guide your own strategy.
- Finance Students: Learn valuation techniques using real-world data and scenarios related to Eni S.p.A. (E).
What the Template Contains
- Preloaded Eni S.p.A. Data: Historical and projected financial data, including revenue, EBIT, and capital expenditures.
- DCF and WACC Models: Professional-grade sheets for calculating intrinsic value and Weighted Average Cost of Capital.
- Editable Inputs: Yellow-highlighted cells for adjusting revenue growth, tax rates, and discount rates.
- Financial Statements: Comprehensive annual and quarterly financials for deeper analysis.
- Key Ratios: Profitability, leverage, and efficiency ratios to evaluate performance.
- Dashboard and Charts: Visual summaries of valuation outcomes and assumptions.
Disclaimer
All information, articles, and product details provided on this website are for general informational and educational purposes only. We do not claim any ownership over, nor do we intend to infringe upon, any trademarks, copyrights, logos, brand names, or other intellectual property mentioned or depicted on this site. Such intellectual property remains the property of its respective owners, and any references here are made solely for identification or informational purposes, without implying any affiliation, endorsement, or partnership.
We make no representations or warranties, express or implied, regarding the accuracy, completeness, or suitability of any content or products presented. Nothing on this website should be construed as legal, tax, investment, financial, medical, or other professional advice. In addition, no part of this site—including articles or product references—constitutes a solicitation, recommendation, endorsement, advertisement, or offer to buy or sell any securities, franchises, or other financial instruments, particularly in jurisdictions where such activity would be unlawful.
All content is of a general nature and may not address the specific circumstances of any individual or entity. It is not a substitute for professional advice or services. Any actions you take based on the information provided here are strictly at your own risk. You accept full responsibility for any decisions or outcomes arising from your use of this website and agree to release us from any liability in connection with your use of, or reliance upon, the content or products found herein.