
|
Groupe de Formule 1 (FWONA): 5 Analyse des forces [Jan-2025 MISE À JOUR] |
Entièrement Modifiable: Adapté À Vos Besoins Dans Excel Ou Sheets
Conception Professionnelle: Modèles Fiables Et Conformes Aux Normes Du Secteur
Pré-Construits Pour Une Utilisation Rapide Et Efficace
Compatible MAC/PC, entièrement débloqué
Aucune Expertise N'Est Requise; Facile À Suivre
Formula One Group (FWONA) Bundle
Plongez dans le monde du groupe de Formule 1 à indice d'octane élevé (FWONA), où la technologie de pointe, le divertissement mondial et la dynamique du marché stratégique convergent pour créer une puissance de sport automobile. Grâce à l'objectif des cinq forces de Michael Porter, nous démêlerons le paysage concurrentiel complexe qui anime cette organisation de course d'élite, explorant comment les fournisseurs spécialisés, les fans passionnés, l'innovation technologique et les barrières stratégiques façonnent sa position de marché remarquable dans l'écosystème mondial du divertissement et du sport automobile.
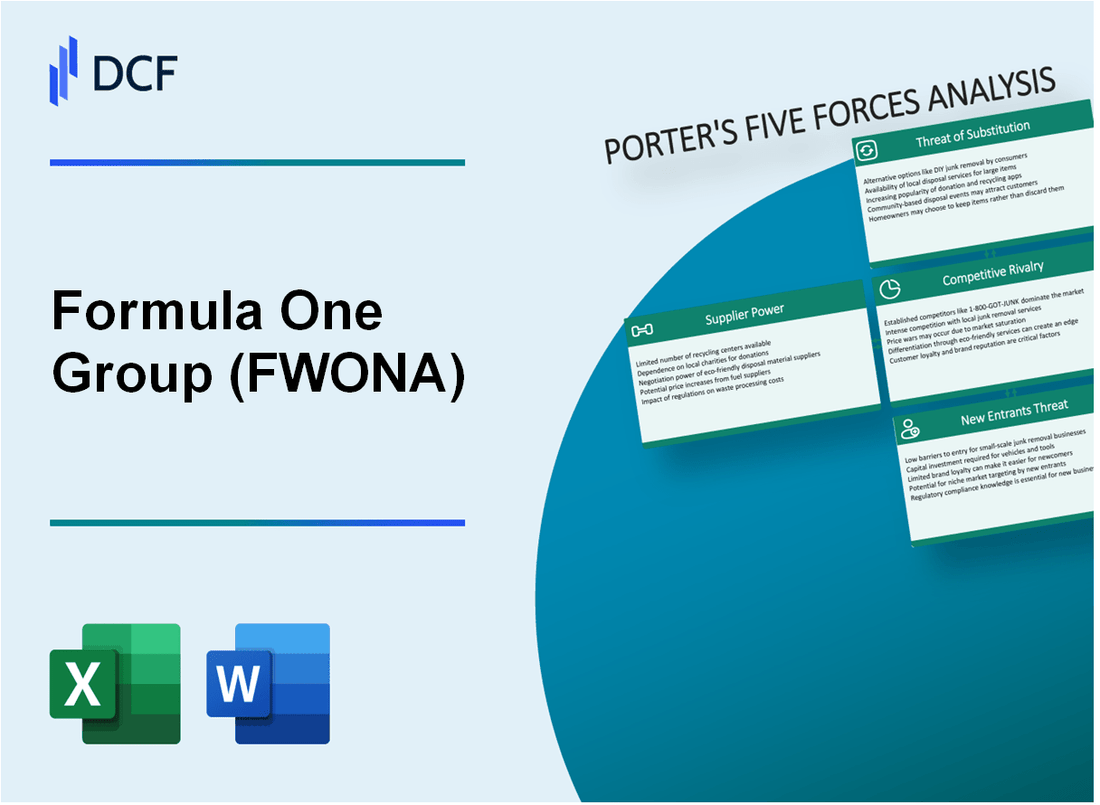
Groupe de Formule 1 (FWONA) - Five Forces de Porter: Pouvoir de négociation des fournisseurs
Nombre limité de circuits de course spécialisés et de fournisseurs de piste
En 2024, seules 24 voies de Formule 1 existent dans le monde, avec un coût de construction moyen de 270 millions de dollars par circuit. Les fournisseurs de piste supérieurs comprennent:
| Fournisseur de piste | Nombre de pistes | Coût de construction moyen |
|---|---|---|
| Tilke GmbH | 15 | 285 millions de dollars |
| Herman Tilke | 9 | 250 millions de dollars |
Haute dépendance à l'égard des fournisseurs de l'automobile et de la technologie
Les équipes de Formule 1 s'appuient sur des fournisseurs spécialisés pour des composants critiques:
- Les groupes motophiles Mercedes-AMG à haute performance fournissent 40% des moteurs F1
- Pirelli fournit exclusivement des pneus de course à toutes les équipes
- Les fournisseurs de fibres de carbone comme Toray Industries Commoisent les prix premium
Investissements importants dans les technologies de course avancées
| Catégorie de technologie | Investissement annuel | Concentration des fournisseurs |
|---|---|---|
| Composants aérodynamiques | 85 millions de dollars | 3 fournisseurs principaux |
| Systèmes électroniques | 62 millions de dollars | 4 fournisseurs spécialisés |
Contrats exclusifs avec la technologie clé et les partenaires automobiles
Détails du contrat du fournisseur clé pour 2024:
- Mercedes-Benz: contrat d'approvisionnement en moteur à 5 ans d'une valeur de 180 millions de dollars
- Petronas: partenariat exclusif en carburant et lubrifiant d'une valeur de 75 millions de dollars par an
- Brembo: Contrat exclusif du système de freinage à 45 millions de dollars par an
Groupe Formule 1 (FWONA) - Five Forces de Porter: Pouvoir de négociation des clients
Base de fans mondiaux et engagement
La Formule 1 compte 552 millions de téléspectateurs uniques à l'échelle mondiale en 2022. Le public Broadcast a atteint 1,55 milliard de téléspectateurs cumulatifs tout au long de la saison. La fréquentation moyenne des courses était de 302 000 spectateurs par Grand Prix.
| Métrique d'audience | 2022 données |
|---|---|
| Téléspectateurs mondiaux uniques | 552 millions |
| Téléspectateurs cumulatifs | 1,55 milliard |
| Fréquentation moyenne de la course | 302,000 |
Sources de revenus
Les revenus de F1 en 2022 étaient de 2,57 milliards de dollars. Les droits de radiodiffusion ont contribué 1,1 milliard de dollars, ce qui représente 42,8% du total des revenus.
- Droits de diffusion: 1,1 milliard de dollars
- Revenus de parrainage: 679 millions de dollars
- Frais de promotion de la course: 642 millions de dollars
Segmentation du marché
Vétonnant démographique clé: L'âge moyen des fans F1 est âgé de 32 ans. 77% des fans sont des hommes. 53% des fans ont entre 16 et 34 ans.
| Segment démographique | Pourcentage |
|---|---|
| Fans masculins | 77% |
| Fans 16-34 ans | 53% |
| Reach des fans mondiaux | 87 pays |
Stratégie de tarification
Les prix moyens des billets varient de 150 $ à 1 500 $ par Grand Prix. Les forfaits hospitaliers premium peuvent coûter jusqu'à 5 000 $.
- Billet standard: 150 $ - 500 $
- Billet premium: 500 $ - 1 500 $
- Paquet d'hospitalité: jusqu'à 5 000 $
Groupe de Formule 1 (FWONA) - Five Forces de Porter: rivalité compétitive
Position du marché dominant dans la course mondiale sur le sport automobile
La Formule 1 a généré 2,573 milliards de dollars de revenus en 2022, ce qui représente 84% de part de marché dans Global Premium Motorsport Entertainment.
| Métrique du marché | Valeur |
|---|---|
| Taille du marché mondial du sport automobile | 3,06 milliards de dollars |
| Part de marché de Formule 1 | 84% |
| Préstance annuelle à la course mondiale | 4,8 millions de fans |
Concurrents directs limités
Les plateformes de divertissement de sport automobile concurrentes comprennent:
- MotoGP - Revenu annuel de 1,2 milliard de dollars
- NASCAR - 660 millions de dollars de revenus annuels
- Championnat du monde d'endurance - 180 millions de dollars de revenus annuels
Solide reconnaissance de la marque
| Métrique de la marque | Valeur |
|---|---|
| Public télévisé mondial | 1,55 milliard de téléspectateurs |
| Abonnés des médias sociaux | 47,3 millions |
| Race Weekend Global Reach | 573 millions de téléspectateurs uniques |
Innovation continue
Investissement technologique: 150 millions de dollars par an dans la recherche et le développement technologiques de course.
- Développement d'unité de puissance hybride
- Génie aérodynamique
- Technologies de carburant durables
Groupe de Formule 1 (FWONA) - Five Forces de Porter: menace de substituts
Plateformes de divertissement de sport automobile alternatives
MotoGP Global Public en 2022: 409,3 millions de téléspectateurs NASCAR TOTAL ANNUEL ANNUEL EN 2022: 1,47 million de fans Valeur marchande mondiale du sport automobile en 2023: 12,4 milliards de dollars
| Plateforme de sport automobile | Public mondial 2022 | Revenus annuels |
|---|---|---|
| Formule 1 | 445 millions | 2,57 milliards de dollars |
| Motogp | 409,3 millions | 1,2 milliard de dollars |
| Nascar | 75 millions | 660 millions de dollars |
Esports croissants et expériences de course virtuelle
Taille du marché des courses eSports en 2023: 1,38 milliard de dollars Marché des courses eSports projetés d'ici 2027: 2,14 milliards de dollars Nombre de participants mondiaux sur les courses eSports en 2022: 12,4 millions
- Utilisateurs de la plate-forme de course SIM: 6,8 millions
- Revenus de jeux de course en ligne en 2022: 542 millions de dollars
- Princule de tournoi de course virtuelle: 3,6 millions de dollars
Plates-formes de divertissement numériques émergentes
Valeur marchande mondiale du divertissement numérique en 2023: 272,8 milliards de dollars Plateformes de streaming avec contenu sportif en 2023: 47 Consommation annuelle de contenu sportif numérique: 3,4 milliards d'heures
Augmentation de la concurrence des événements sportifs mondiaux
| Événement sportif | Public mondial | Revenus annuels |
|---|---|---|
| Coupe du monde de la FIFA | 5,4 milliards | 6,4 milliards de dollars |
| Jeux olympiques | 3,6 milliards | 5,2 milliards de dollars |
| Ligue des champions de l'UEFA | 380 millions | 2,9 milliards de dollars |
Le paysage concurrentiel indique des risques de substitution importants sur plusieurs plateformes de divertissement
Groupe de Formule 1 (FWONA) - Five Forces de Porter: menace de nouveaux entrants
Exigences de capital initiales élevées
Coûts d'établissement d'équipe de Formule 1: 145 millions de dollars à 400 millions de dollars d'investissement initial. Budget opérationnel annuel: 145 millions de dollars par équipe au cours des réglementations de la FIA 2024.
| Catégorie de coûts | Montant estimé |
|---|---|
| Développement de voitures de course | 50-75 millions de dollars |
| Configuration de l'infrastructure | 30 à 50 millions de dollars |
| Dépenses opérationnelles annuelles | 145 millions de dollars |
Environnement réglementaire complexe
La conformité réglementaire de la FIA nécessite une documentation technique et financière approfondie.
- Coûts de certification de sécurité obligatoires: 2,5 millions de dollars
- Frais d'inspection technique annuelle: 500 000 $
- Documentation juridique et de conformité: 750 000 $
Barrières technologiques
Les exigences technologiques avancées créent des défis d'entrée importants.
| Investissement technologique | Gamme de coûts |
|---|---|
| Test de souffrance | 20 à 40 millions de dollars par an |
| Dynamique du liquide informatique | 5 à 10 millions de dollars par an |
| Technologie de simulation | 15-25 millions de dollars |
Défis d'entrée sur le marché
La domination du marché de l'équipe établie crée des obstacles substantiels.
- Revenus de l'équipe Mercedes F1: 487 millions de dollars en 2022
- Revenus Red Bull Racing: 419 millions de dollars en 2022
- Valeur de l'équipe Ferrari: 1,35 milliard de dollars
Formula One Group (FWONA) - Porter's Five Forces: Competitive rivalry
You're looking at the core engine of Formula One Group (FWONA)'s value proposition: the sheer intensity of the competition on track. Internal rivalry among the 10 teams is not a bug; it's the primary feature that Formula One Group sells to broadcasters, sponsors, and fans. This rivalry creates the must-watch drama that underpins the entire commercial structure.
The 2025 season, as of late 2025, definitely exemplifies this. We're seeing a genuine multi-team championship fight, which is far more valuable commercially than a single-team procession. For instance, looking at the Constructors' Championship standings post-Mexico, the fight for the top spots is razor-thin, driving engagement right into the final races.
Consider the points gap between the top contenders in the late stages of the 2025 season:
- McLaren leads with 756 points.
- Mercedes-AMG Petronas trails with 398 points.
- Oracle Red Bull Racing is close behind at 366 points.
- Scuderia Ferrari HP sits at 362 points.
That gap of only 10 points between second and fourth place means every single race result, including Sprint events, directly impacts the final financial outcome for the season. That's the kind of volatility investors love to see in a live entertainment product.
To manage this intense competition and ensure the long-term viability of the grid-preventing any one team from simply outspending everyone else into oblivion-Formula One Group, via the FIA, enforces strict financial controls. The rivalry is thus channeled into engineering efficiency rather than pure spending power, which is key to stability.
The primary mechanism for this is the Cost Cap. For the 2025 fiscal year, the effective operational cost cap, adjusted for inflation on the baseline, sits around $141.2 million per team. This figure is a hard ceiling on performance-related spending, excluding items like driver salaries and the top three executive wages. Furthermore, Power Unit (PU) manufacturers face a separate cap for their engine development, which is set at $95 million for the 2022-2025 period.
The financial reward for success within this cap structure is substantial, directly linking on-track performance to budget for the following year. The total prize money pool is derived from a percentage of Formula One Group's commercial revenue, which reached approximately $3.65 billion in 2024. The distribution structure, governed by the Concorde Agreement, heavily rewards the Constructors' Championship finish.
Here's a look at the financial stratification based on the 2024 year-end distribution, which sets the budget expectation for 2025 performance:
| Constructors' Rank (2024) | Estimated Prize Money Share (Approximate %) | Estimated Payout (USD) |
| 1st (McLaren) | Approx. 14% | Approx. $140 million |
| 3rd (Red Bull Racing) | Mid-teens percentage | Substantially more than 10th place |
| 10th (Sauber) | Approx. 6% | Approx. $60 million |
The delta between positions is what really matters for resource allocation. A swing from P3 to P4 in the final standings can mean a difference of $10-15 million in the performance share alone. That's a massive amount of capital that can be deployed into non-capped areas or used to fund infrastructure improvements.
This competitive environment is further complicated by the impending 2026 regulation change, which forces a difficult resource allocation decision in 2025. Teams must balance maximizing performance with the current cost cap against investing heavily in the new technical rules-lighter cars, active aerodynamics, and new power unit specifications-which will operate under a new financial structure. The 2026 cost cap is slated to rise to approximately $215 million, and the PU cap will increase to $130 million. Teams that can afford to shift R&D focus early, perhaps sacrificing a few points in 2025, gain a strategic advantage for the 2026 reset. It's a classic 'limbo' season where short-term results clash with long-term platform investment.
Formula One Group (FWONA) - Porter's Five Forces: Threat of substitutes
You're analyzing the competition for audience attention and dollars, and honestly, Formula One Group (FWONA) faces a unique set of substitutes. The threat from direct motorsport rivals is currently manageable because Formula One Group dominates the global single-seater space and carries a luxury brand cachet that others struggle to match. For instance, as of August 2025, Formula One Group boasts a global fanbase of 827 million, marking a 12% year-on-year increase. This dwarfs the reach of its closest single-seater competitor, IndyCar, which drew 1.06 million viewers for its Detroit Grand Prix in 2025.
The unique combination of cutting-edge technology, global glamour, and a prestigious calendar makes replicating the Formula One Group offering incredibly difficult, which effectively raises the switching costs for both dedicated fans and major sponsors. Consider the financial commitment: the average amount of an F1 sponsorship deal has climbed to $5.08 million today, up from $2.87 million in 2019. Furthermore, the reported asking price for Formula One Group's US TV rights is reportedly between $160 million and $180 million annually, a significant jump from the current estimated $90 million per year.
Here's a quick look at how US viewership stacked up for key events in 2025, showing Formula One Group's strong position:
| Motorsport Property | Event Example (2025) | US Viewership (Millions) |
| Formula One Group | Monaco Grand Prix (Live) | 2.3 |
| NASCAR | Nashville Superspeedway | 2.06 |
| IndyCar | Detroit Grand Prix | 1.06 |
The more significant substitute threat comes from general entertainment content, which competes directly for audience time and attention, especially among younger demographics. This is where streaming services and the booming eSports industry become major rivals. The impact of the Drive to Survive series is clear, as one in four viewers stated they became F1 fans after watching the show. Also, the F1 movie is projected to gross $600 million at the box office, positioning it as the largest-grossing sports film ever, showing the power of entertainment crossovers.
The growth in eSports viewership is substantial, directly pulling attention away from live sports. You should note these figures:
- Global esports audience projected to reach over 640 million by the end of 2025.
- The global esports industry revenue is expected to hit $1.79 billion in 2025.
- 76% of esports fans devote more time to esports than traditional sports.
- The Esports World Cup (EWC) 2025 generated 168M hours watched.
Regarding US viewership stabilization, while the initial post-Drive to Survive spike may have moderated, the growth remains strong, suggesting entrenchment rather than plateauing. For example, the average Formula One Group race in 2025 pulls in 1.3 million viewers per event on ABC, ESPN, and ESPN2, which is an 18% jump from the 1.1 million average across 2023 and 2024. Even the early-season Chinese Grand Prix drew 824,000 viewers on ESPN, a 32% rise compared to the 624,000 viewers for the same race in 2024. The US fanbase has grown by 10.5% over the past year, reaching 52 million fans. Finance: review the Q4 2025 media spend allocation across US broadcast vs. streaming platforms by next Tuesday.
Formula One Group (FWONA) - Porter's Five Forces: Threat of new entrants
You're looking at the entry barriers for Formula One Group (FWONA) as of late 2025, and honestly, they are fortress-like. The financial hurdles alone are designed to filter out almost everyone. It's not just about having a checkbook; it's about having a multi-billion-dollar commitment before you even turn a wheel in anger.
The mandatory financial barrier to entry is explicitly structured to compensate existing participants for the dilution of their commercial rights revenue share. Under the existing Concorde Agreement, the figure was set at a flat $200 million. However, the market has clearly re-priced this entry right. For the confirmed 2026 entry, Cadillac agreed to a one-time anti-dilution fee of $450 million. This massive fee is distributed equally among the ten incumbent teams, meaning each existing team receives $45 million from the newcomer. Considering the total prize money pool was potentially as high as $1.5 billion in 2025, this fee is an insurance policy against a smaller slice of a very large pie.
Here's a quick look at the scale of the financial commitment required just to get a seat at the table, versus the ongoing operational costs:
| Cost Component | Reported/Estimated Amount (USD) | Context/Applicability |
|---|---|---|
| Mandatory Anti-Dilution Fee (Pre-2026 Agreement) | $200 million | Flat fee under the 2021-2025 Concorde Agreement |
| Agreed Anti-Dilution Fee (2026 Entry) | $450 million | Fee paid by Cadillac for 2026 entry |
| Estimated Initial Facility & Fit-Out Cost | Over $1.12 billion (approx. £830 million) | Start-up cost excluding anti-dilution fee and initial operating budget |
| Annual Operational Cost Cap (2023-2025) | $135 million | Base figure for the chassis/car development budget cap |
| Annual Power Unit R&D Cap (2023-2025) | $95 million | Annual limit for engine manufacturers' R&D spend |
| Estimated Top Team Actual Annual Spend (Pre-Cap Exclusions) | Up to $350 million | Actual spending by leading teams, factoring in excluded costs like driver salaries |
Technical barriers are just as imposing. You can't just buy an off-the-shelf engine and chassis kit. You need bespoke, proprietary hybrid power units, which is a massive R&D sinkhole. For context, one manufacturer's commitment to developing its V6 hybrid engine over the era was estimated to cost around $1.4 billion. While the engine budget cap for 2023 through 2025 is set at $95 million annually, this is set to increase to $130 million from 2026 to accommodate the new regulations.
Furthermore, the physical infrastructure required is immense. Building a factory with the necessary specialized facilities-like wind tunnels and advanced manufacturing lines-is a capital expenditure event in itself. Estimates suggest the cost to fit out a new operation, separate from the entry fee, can easily exceed $1.12 billion. This level of technical and capital investment immediately screens out all but the most well-funded automotive manufacturers or sovereign wealth-backed entities.
The governance structure itself acts as a major deterrent. The FIA and Formula One Management (FOM) maintain absolute control over the grid size and the entry process. This isn't a free market; it's a controlled expansion. The successful entry of Cadillac for 2026, following a lengthy negotiation and the agreement on the $450 million fee, demonstrates that entry is granted by permission, not simply by meeting a minimum technical standard. The 2025 grid consists of 10 teams, and any addition requires unanimous commercial agreement from the existing participants.
Finally, the threat from a completely new, competing global open-wheel series remains negligible. The historical prestige and established global infrastructure of Formula One-which commands an estimated commercial revenue approaching $4 billion in recent years-is an asset that cannot be replicated quickly or cheaply. Competitors like IndyCar operate on budgets in the range of $7 to $10 million per car, a fraction of the $135 million cost cap for the car development portion of an F1 team's budget. That performance gap, driven by the financial scale, keeps alternative series firmly in a secondary position.
Disclaimer
All information, articles, and product details provided on this website are for general informational and educational purposes only. We do not claim any ownership over, nor do we intend to infringe upon, any trademarks, copyrights, logos, brand names, or other intellectual property mentioned or depicted on this site. Such intellectual property remains the property of its respective owners, and any references here are made solely for identification or informational purposes, without implying any affiliation, endorsement, or partnership.
We make no representations or warranties, express or implied, regarding the accuracy, completeness, or suitability of any content or products presented. Nothing on this website should be construed as legal, tax, investment, financial, medical, or other professional advice. In addition, no part of this site—including articles or product references—constitutes a solicitation, recommendation, endorsement, advertisement, or offer to buy or sell any securities, franchises, or other financial instruments, particularly in jurisdictions where such activity would be unlawful.
All content is of a general nature and may not address the specific circumstances of any individual or entity. It is not a substitute for professional advice or services. Any actions you take based on the information provided here are strictly at your own risk. You accept full responsibility for any decisions or outcomes arising from your use of this website and agree to release us from any liability in connection with your use of, or reliance upon, the content or products found herein.