|
Group Oatly AB (Otly): 5 Analyse des forces [Jan-2025 MISE À JOUR] |
Entièrement Modifiable: Adapté À Vos Besoins Dans Excel Ou Sheets
Conception Professionnelle: Modèles Fiables Et Conformes Aux Normes Du Secteur
Pré-Construits Pour Une Utilisation Rapide Et Efficace
Compatible MAC/PC, entièrement débloqué
Aucune Expertise N'Est Requise; Facile À Suivre
Oatly Group AB (OTLY) Bundle
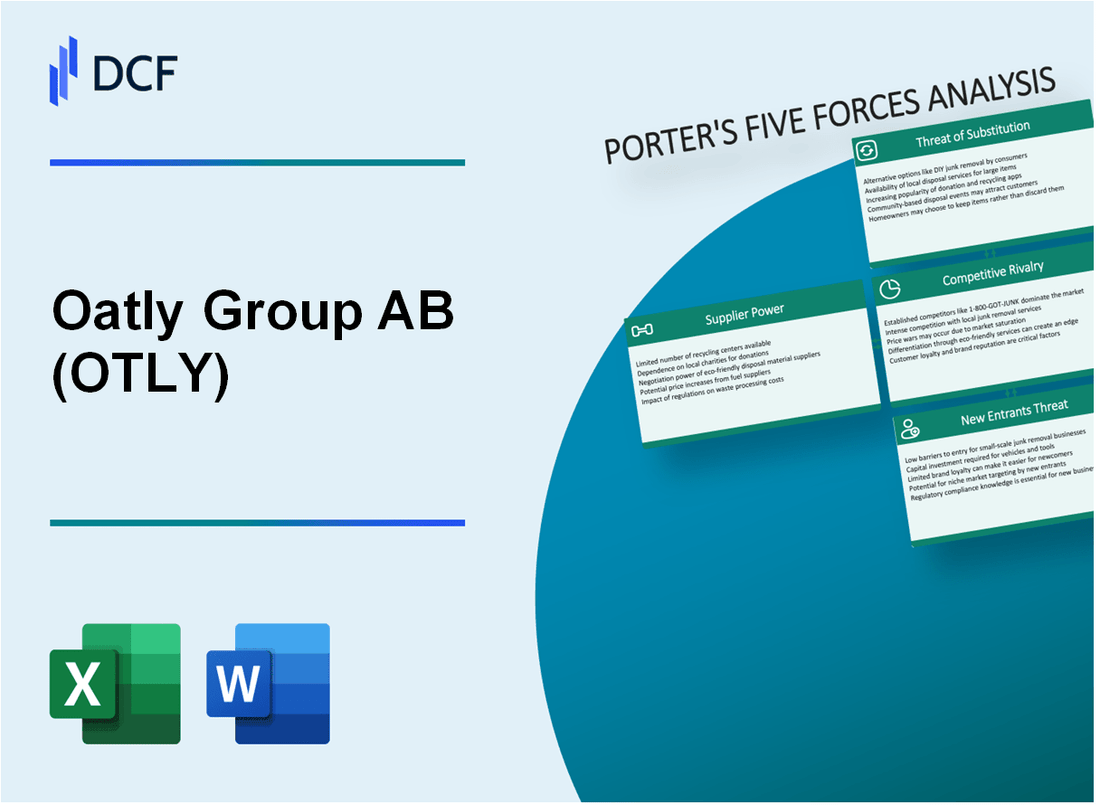
Dans le paysage en évolution rapide des boissons à base de plantes, Oatly Group AB se situe au carrefour de l'innovation, de la durabilité et de la dynamique du marché. Alors que les consommateurs recherchent de plus en plus des alternatives laitières qui s'alignent sur la santé et les valeurs environnementales, la compréhension des forces stratégiques qui façonnent la position concurrentielle d'Oatly devient cruciale. À travers le cadre des cinq forces de Michael Porter, nous plongerons profondément dans l'écosystème complexe de la production de lait d'avoine, révélant les défis et les opportunités complexes qui définissent le parcours d'Oatly dans un marché mondial farouchement compétitif.
Groupe Oatly AB (Otly) - Five Forces de Porter: Pouvoir de négociation des fournisseurs
Nombre limité de fournisseurs d'OAT spécialisés
En 2024, les fournisseurs d'OAT spécialisés mondiaux sont concentrés dans les régions clés:
| Région | Production annuelle de l'avoine | Principaux fournisseurs |
|---|---|---|
| Canada | 3,2 millions de tonnes métriques | Richardson International |
| États-Unis | 1,7 million de tonnes métriques | Meuns de grains |
| Finlande | 1,1 million de tonnes métriques | Moulins de Fazer |
Demande d'élevage d'avoine biologique et durable
Statistiques du marché de l'avoine biologique:
- Valeur marchande mondiale de l'avoine organique: 1,3 milliard de dollars en 2023
- Taux de croissance du marché projeté: 7,2% par an
- Les terres agricoles de l'avoine biologique ont augmenté de 18% entre 2020-2023
Contraintes de chaîne d'approvisionnement
Défis agricoles ayant un impact sur la production d'avoine:
| Facteur climatique | Impact sur la production d'avoine | Pourcentage de variation |
|---|---|---|
| Conditions de sécheresse | Réduction des rendements des cultures | 12-15% de diminution de la production |
| Variations de température | Fluctuations de qualité des cultures | 8 à 10% de variation de qualité |
Analyse de la concentration des fournisseurs
Métriques de concentration des fournisseurs:
- Les 5 meilleurs fournisseurs d'avoine contrôlent 62% du marché mondial
- Durée du contrat moyen des fournisseurs: 2-3 ans
- Gamme de volatilité des prix: 5-8% par an
Groupe Oatly AB (Otly) - Five Forces de Porter: Pouvoir de négociation des clients
Préférence croissante des consommateurs pour les alternatives au lait à base de plantes
La taille mondiale du marché du lait à base de plantes a atteint 20,1 milliards de dollars en 2022, prévoyant à 41,8 milliards de dollars d'ici 2029, avec un TCAC de 10,9%. La part de marché mondiale d'Oatly dans le segment du lait d'avoine était d'environ 45% en 2023.
| Segment de marché | Valeur 2022 | 2029 Valeur projetée | TCAC |
|---|---|---|---|
| Marché du lait à base de plantes | 20,1 milliards de dollars | 41,8 milliards de dollars | 10.9% |
Santé sensible aux prix et segment de marché soucieux de l'environnement
62% des consommateurs tiennent compte de la durabilité lors de l'achat de produits alimentaires. Le prix moyen du lait d'avoine à l'avoine varie entre 4,50 $ et 5,99 $ par demi-gallon.
- Préférence de durabilité des consommateurs: 62%
- Prix de lait d'avoine à l'avoine moyen: 4,50 $ - 5,99 $
Faible coût de commutation entre les marques de lait à base de plantes
Le coût moyen de commutation des consommateurs entre les marques de lait à base de plantes estimées de 0,50 $ à 1,50 $ par achat. Plus de 30 marques de lait d'avoine compétitives disponibles sur le marché.
| Métrique | Valeur |
|---|---|
| Plage de coûts de commutation | $0.50 - $1.50 |
| Marques de lait d'avoine compétitives | 30+ |
Solides canaux de distribution de vente au détail et de commerce électronique
Distribué à l'avoine dans plus de 20 pays, disponible dans plus de 75 000 emplacements de vente au détail. Les ventes de lait à base de commerce électronique ont augmenté de 27,3% en 2022.
- Pays de distribution: 20+
- Emplacements de détail: 75 000+
- Croissance des ventes de lait à base de commerce électronique: 27,3%
Groupe Oatly AB (Otly) - Five Forces de Porter: rivalité compétitive
Concurrence sur le marché Overview
En 2024, Oatly fait face à une concurrence intense sur le marché du lait à base de plantes avec les principaux concurrents suivants:
| Concurrent | Part de marché | Revenus mondiaux (2023) |
|---|---|---|
| Soie | 12.4% | 875 millions de dollars |
| Alpro | 9.7% | 642 millions de dollars |
| Danone | 15.3% | 1,2 milliard de dollars |
| Se nicher | 17.6% | 1,5 milliard de dollars |
Dynamique du paysage concurrentiel
Le marché du lait à base de plantes démontre une intensité concurrentielle importante avec les caractéristiques suivantes:
- Taille mondiale du marché du lait à base de plantes: 23,4 milliards de dollars en 2023
- Taux de croissance du marché projeté: 12,7% par an
- Nombre de concurrents actifs: 47 marques mondiales
Stratégies compétitives clés
Les stratégies de différenciation compétitive comprennent:
- Focus sur la durabilité: Réduction de l'empreinte carbone
- Innovation de produit: Formulations nutritionnelles avancées
- Technologie d'emballage: Matériaux respectueux de l'environnement
Positionnement du marché
La position du marché d'Oatly reflète:
| Métrique | Valeur |
|---|---|
| Part de marché | 8.2% |
| Revenus mondiaux (2023) | 690 millions de dollars |
| Variantes de produits | 14 lignes de produits différentes |
Groupe Oatly AB (Otly) - Five Forces de Porter: menace de substituts
Augmentation de la variété d'alternatives au lait à base de plantes
En 2023, le marché mondial du lait à base de plantes était évalué à 22,9 milliards de dollars. Les segments de lait alternatifs comprennent:
| Alternative au lait | Part de marché (%) | Taux de croissance annuel |
|---|---|---|
| Lait d'amande | 35.2% | 6.5% |
| Lait de soja | 27.8% | 4.3% |
| Lait d'avoine | 18.5% | 9.2% |
| Lait de riz | 12.7% | 3.9% |
Intérêt croissant des consommateurs pour les options sans produits laitiers
Les préférences des consommateurs indiquent:
- 48% des consommateurs recherchent activement des alternatives sans produits laitiers
- L'intolérance au lactose affecte environ 68% de la population mondiale
- La consommation de lait à base de plantes a augmenté de 61% entre 2019-2022
Bêtises de protéines alternatives émergentes
Statistiques du marché des boissons protéiques émergentes:
| Source de protéines | Valeur marchande 2023 | Croissance projetée |
|---|---|---|
| Lait de protéines de pois | 1,2 milliard de dollars | 12.4% |
| Lait de chanvre | 580 millions de dollars | 8.7% |
| Boissons à la protéine de noix de coco | 890 millions de dollars | 10.2% |
Concurrence potentielle des solutions de lait à base de plantes maison
Informations sur le marché de la préparation à domicile:
- 27% des consommateurs déclarent faire du lait à base de plantes à la maison
- Coût moyen du lait d'avoine fait maison: 0,50 $ par litre
- Prix moyen de lait d'avoine commercial: 3,20 $ par litre
Groupe Oatly AB (Otly) - Five Forces de Porter: menace de nouveaux entrants
Investissement initial élevé requis pour les installations de production
Les installations de production d'Oatly nécessitent des investissements en capital importants. En 2023, la propriété totale, l'usine et l'équipement de la société était évaluée à 378,4 millions de dollars. Les nouveaux participants auraient besoin d'environ 50 à 75 millions de dollars pour établir des capacités de production comparables.
Défis de reconnaissance de la marque établies
| Métrique de la marque | Valeur d'avoine |
|---|---|
| Sensibilisation mondiale sur la marque | 62% sur les marchés clés |
| Abonnés des médias sociaux | 1,2 million |
| Part de marché dans le lait à base de plantes | 14,3% à l'échelle mondiale |
Augmentation des exigences réglementaires
Les coûts de conformité réglementaire des aliments et des boissons pour les nouveaux participants peuvent varier entre 500 000 $ et 2,5 millions de dollars par an, selon l'échelle de production et la complexité du marché.
Barrières de chaîne d'approvisionnement complexes
- Oatly a établi des relations avec 127 fournisseurs mondiaux
- Durée du contrat moyen des fournisseurs: 3-5 ans
- Coûts d'optimisation de la chaîne d'approvisionnement: 12,7 millions de dollars par an
Dépenses de marketing et de création de marque importantes
Les dépenses de marketing d'Oatly en 2022 étaient de 89,6 millions de dollars, ce qui représente 23% des revenus totaux. Les nouveaux entrants devraient investir de manière similaire pour gagner du terrain du marché.
Oatly Group AB (OTLY) - Porter's Five Forces: Competitive rivalry
You're looking at the competitive landscape for Oatly Group AB right now, and honestly, the rivalry is fierce. This isn't a sleepy market; it's a sector where every percentage point of market share is fought for, especially as overall category growth stalls.
Direct competition is intense from well-funded rivals like Silk, which is backed by Danone, and Chobani. These players have deep pockets for marketing and distribution, putting constant pressure on Oatly Group AB's pricing and shelf presence. To be fair, Oatly Group AB is still fighting hard to maintain its premium positioning, reporting Q1 2025 revenue of $197.5 million.
The fight for the consumer dollar is evident when you look at the broader sector. The overall alternative milk sector saw a 4.4% sales decline last year in US Omni Sales, intensifying the fight for market share. This macroeconomic pressure means that Oatly Group AB's ability to grow volume, even against category headwinds, is crucial. Globally, Oatly Group AB competes across over 50 countries, which diversifies the rivalry but also stretches resources across varied competitive environments.
Here's a quick look at how Oatly Group AB's retail performance stacked up against the category in its largest market during Q1 2025. You can see the direct head-to-head battle:
| Metric (Europe & International Retail, Q1 2025) | Oatly Group AB Performance | Overall Oat Milk Category Performance |
| Year-on-Year Retail Growth | 4.6% | +2.8% |
| Plant-Based Milk Category Growth (for context) | N/A | +3.5% |
Oatly's Q1 2025 retail growth of 4.6% in Europe & International just slightly outpaced the overall oat milk category growth of 2.8% in that channel. This outperformance, driven by a 4.0% volume increase in the segment, shows the brand's strength in its core barista offerings, even as its price/mix declined by 4.0%.
Competition is based on several key differentiators beyond just price. For Oatly Group AB, the battle is fought on several fronts:
- Brand equity, which supports premium pricing.
- Proprietary technology, underpinning product quality.
- Barista performance, securing crucial foodservice placement.
The regional disparity in rivalry intensity is significant. While the company saw strong volume growth globally of 9.2% in Q1 2025, North America was a major drag, recording a 10.6% revenue drop and a 10.9% volume drop. Conversely, Greater China was the bright spot, with revenue jumping 37.6%. This unevenness means rivalry management is highly localized.
To maintain its footing, Oatly Group AB is focused on operational improvements, evidenced by its Q1 2025 gross margin hitting 31.6%, an increase of 4.5 percentage points year-over-year. The goal is to turn this operational efficiency into sustained market gains, targeting full-year 2025 constant currency revenue growth of 2% to 4% and positive adjusted EBITDA between $5 million to $15 million.
The intensity of rivalry is also reflected in the broader US plant-based milk segment, which saw dollar sales decline 5.2% in the year ending July 14, 2024. This environment forces Oatly Group AB to constantly defend its value proposition against both established rivals and private label options.
Finance: model sensitivity of FY2025 Adjusted EBITDA guidance based on a 100 basis point shift in North America revenue growth by end of Q3.
Oatly Group AB (OTLY) - Porter's Five Forces: Threat of substitutes
You're analyzing Oatly Group AB's competitive landscape as of late 2025, and the threat from substitutes is definitely a major headwind. This force is powerful because consumers can easily switch to alternatives that meet their needs for a beverage, whether for taste, nutrition, or function in coffee.
Traditional dairy milk remains a massive, low-cost substitute. While Oatly Group AB posted total revenue of $222.8 million in Q3 2025, the scale of the conventional dairy market dwarfs this figure, benefiting from centuries of scale and established infrastructure. For context, in 2024, the average price for a gallon of cow's milk in US supermarkets was $4.21, significantly lower than the average plant-based milk price of $7.27 per gallon that same year. This cost differential creates a persistent barrier for price-sensitive consumers, even as Oatly Group AB achieved positive adjusted EBITDA of $3.1 million in Q3 2025.
Other plant-based milks (almond, soy, coconut) are widely available and established. These substitutes compete directly within the growing dairy alternatives space, which in the US accounted for $7.5 Billion in market size in 2024, with the overall US plant-based milk market estimated at $5,395.34 million in 2025. Almond milk, in particular, leads the global plant-based segment, holding an estimated market share of over 35% in 2025, suggesting a highly fragmented and competitive environment for Oatly Group AB.
The competitive landscape among plant-based options is clear when looking at segment performance. Oatly Group AB's North America revenue in Q3 2025 was $62.096 million, representing a 10.1% drop year-over-year, indicating that other substitutes may be gaining traction in that key market. Conversely, Oatly Group AB's Europe & International segment revenue was $123.267 million in the same quarter, showing stronger performance.
Misinformation about oat milk health acts as a barrier, pushing consumers to other options. While Oatly Group AB focuses on its oat-based expertise, consumers often weigh nutritional profiles, which vary significantly across substitutes. This forces Oatly Group AB to constantly justify its value proposition against established nutritional benchmarks.
Consumer preferences are shifting, with a trend back toward dairy options in some segments. This is evidenced by Oatly Group AB's 10.1% reported revenue decline in North America in Q3 2025, even as the company reported its highest quarterly total revenue ever at $222.8 million globally for that period. This regional weakness suggests that for some consumers, the perceived benefits of plant-based options are not outweighing the established familiarity or pricing of dairy.
Substitutes offer varied nutritional profiles and price points. You need to map these out to understand where Oatly Group AB is positioned, especially since its Q3 2025 net loss was $65.3 million (largely due to non-operational factors like convertible notes, but still a financial reality). Here's a quick comparison of general market positioning for key substitutes:
| Substitute Category | 2024 Avg. Gallon Price (US Supermarket) | Key Nutritional/Market Trait |
| Traditional Dairy Milk | $4.21 | Complete protein; massive scale/low cost |
| Plant-Based Milk (Average) | $7.27 | Growing market, projected $21.9 Bn globally in 2025 |
| Almond Milk | Near or above average plant-based price | Leads global plant-based share at over 35% (2025 Est.) |
| Oat Milk (Oatly Example, 2023) | Approx. 8 cents per ounce | Strong foodservice presence (Greater China revenue up 28.8% in Q3 2025) |
The threat is multifaceted, coming from both the legacy dairy industry and the rapidly evolving plant-based sector itself. Oatly Group AB's ability to maintain its premium positioning hinges on its brand relevance, particularly against established leaders like almond milk and the ever-present low cost of dairy. You should watch the Q4 2025 North American sales figures closely to see if the US slump continues.
Oatly Group AB (OTLY) - Porter's Five Forces: Threat of new entrants
You're looking at the barriers new competitors face when trying to break into the oat drink space Oatly Group AB (OTLY) dominates. The threat isn't zero, but there are definite hurdles built up over time.
Proprietary enzyme technology for oat base creates a significant, though not insurmountable, product barrier. Oatly's patented enzyme technology is what allows them to transform high-fiber oats into a liquid with a creamy texture, mimicking dairy while retaining beneficial components like beta-glucan. This scientific foundation, originating from research at Lund University, is a core differentiator that new entrants must replicate or circumvent. This technology underpins the product's distinctive quality.
High capital expenditure is required for large-scale production, though Oatly's 2025 CapEx is reduced to $20 million. This figure, reaffirmed in their latest guidance, shows a commitment to maintaining operational scale, which is a significant upfront cost for any new player looking to match Oatly Group AB (OTLY)'s capacity. Building out the necessary processing and manufacturing infrastructure demands substantial investment.
Established food and beverage giants can enter the market quickly, leveraging existing distribution networks. The sheer scale of incumbents means they can deploy resources rapidly. For context, the overall plant-based milk market reached an estimated $25 to $28 billion globally in 2024. These established players can absorb the initial losses associated with category entry using their existing shelf space agreements and logistics.
Strong brand loyalty and high marketing costs are needed to compete with Oatly's distinctive brand. Oatly Group AB (OTLY) has cultivated a lifestyle brand image, which requires sustained, high-cost communication to match. At one point, out-of-home advertising, like billboards and buses, comprised about 60% of their marketing budget. The cultural relevance they built-which supported a market valuation of over $10 billion around their 2021 IPO-is not easily bought by a newcomer.
Access to premium foodservice channels (barista segment) is a high initial barrier for startups. Oatly Group AB (OTLY) has deeply embedded itself in the coffee community, which drives trial and reinforces premium positioning. The success in this area is evident in regional performance; for instance, the Greater China segment saw its foodservice revenue jump by 38% to $30 million in the first half of 2025, and the Europe & International segment's barista oat milk lineup drove volume growth. New entrants must fight for these critical placements.
Here's a quick look at the key barriers and associated figures:
| Barrier Component | Data Point | Context/Year |
|---|---|---|
| Technology Barrier | Patented enzyme technology | Core product differentiator |
| Capital Barrier | $20 million | Oatly Group AB (OTLY) 2025 Capital Expenditure guidance |
| Scale Barrier | $25 to $28 billion | Global plant-based milk market size (estimated 2024) |
| Brand Barrier | 60% | Proportion of OOH advertising in a past marketing budget |
| Channel Barrier | 12% | Revenue growth in Greater China foodservice (H1 2025) |
New entrants must overcome several hurdles:
- Develop proprietary, scalable enzyme processing.
- Secure capital expenditure exceeding Oatly Group AB (OTLY)'s $20 million for 2025.
- Compete against incumbent distribution muscle.
- Match brand equity that once valued the company near $10 billion.
- Gain traction in the high-value barista segment, which saw $30 million in Q1 2025 revenue for one segment.
Finance: review the CapEx allocation against new market entry modeling by next Tuesday.
Disclaimer
All information, articles, and product details provided on this website are for general informational and educational purposes only. We do not claim any ownership over, nor do we intend to infringe upon, any trademarks, copyrights, logos, brand names, or other intellectual property mentioned or depicted on this site. Such intellectual property remains the property of its respective owners, and any references here are made solely for identification or informational purposes, without implying any affiliation, endorsement, or partnership.
We make no representations or warranties, express or implied, regarding the accuracy, completeness, or suitability of any content or products presented. Nothing on this website should be construed as legal, tax, investment, financial, medical, or other professional advice. In addition, no part of this site—including articles or product references—constitutes a solicitation, recommendation, endorsement, advertisement, or offer to buy or sell any securities, franchises, or other financial instruments, particularly in jurisdictions where such activity would be unlawful.
All content is of a general nature and may not address the specific circumstances of any individual or entity. It is not a substitute for professional advice or services. Any actions you take based on the information provided here are strictly at your own risk. You accept full responsibility for any decisions or outcomes arising from your use of this website and agree to release us from any liability in connection with your use of, or reliance upon, the content or products found herein.