
|
Rimini Street, Inc. (RMNI) Évaluation DCF |
Entièrement Modifiable: Adapté À Vos Besoins Dans Excel Ou Sheets
Conception Professionnelle: Modèles Fiables Et Conformes Aux Normes Du Secteur
Pré-Construits Pour Une Utilisation Rapide Et Efficace
Compatible MAC/PC, entièrement débloqué
Aucune Expertise N'Est Requise; Facile À Suivre
Rimini Street, Inc. (RMNI) Bundle
Gagnez du temps et améliorez la précision avec notre calculatrice DCF [RMNI]! Avec Real Rimini Street, Inc. Données et des hypothèses personnalisables, cet outil vous permet de prévoir, analyser et valoriser [RMNI] comme un investisseur chevronné.
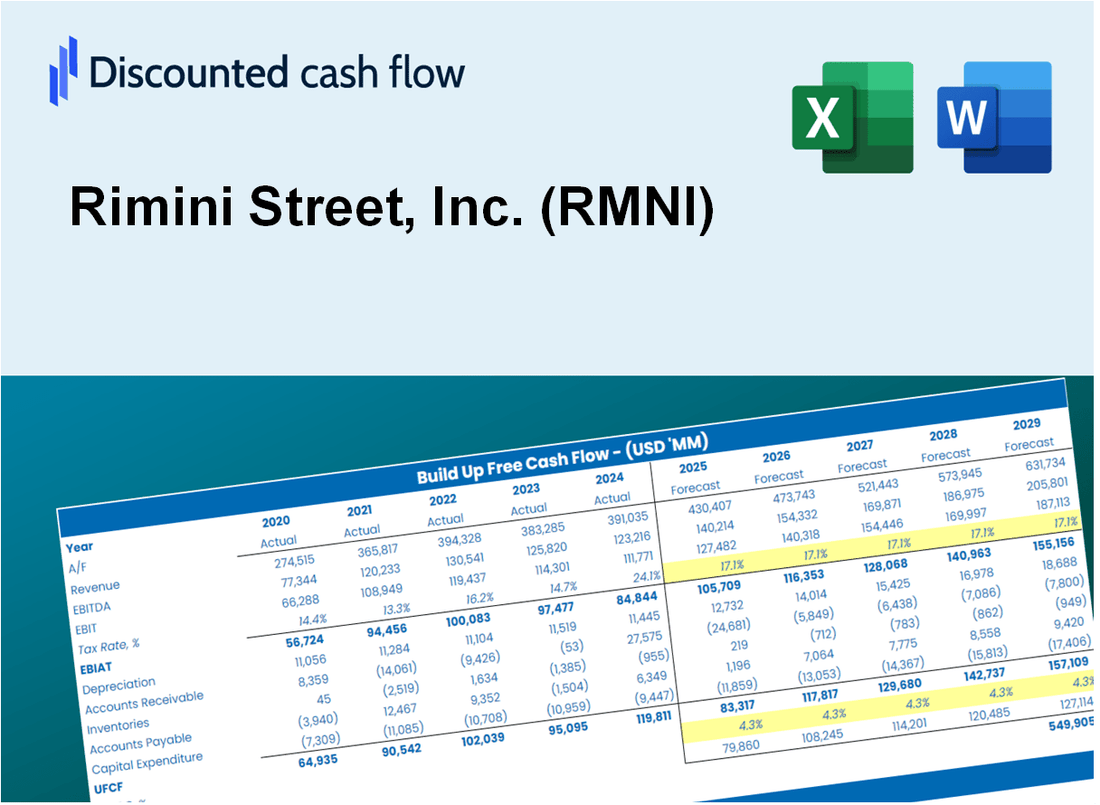
Discounted Cash Flow (DCF) - (USD MM)
| Year | AY1 2020 |
AY2 2021 |
AY3 2022 |
AY4 2023 |
AY5 2024 |
FY1 2025 |
FY2 2026 |
FY3 2027 |
FY4 2028 |
FY5 2029 |
|---|---|---|---|---|---|---|---|---|---|---|
| Revenue | 326.8 | 374.4 | 409.7 | 431.5 | 428.8 | 471.1 | 517.5 | 568.6 | 624.7 | 686.3 |
| Revenue Growth, % | 0 | 14.58 | 9.41 | 5.33 | -0.6357 | 9.87 | 9.87 | 9.87 | 9.87 | 9.87 |
| EBITDA | 18.0 | 23.4 | 10.6 | 50.4 | -22.2 | 19.7 | 21.6 | 23.7 | 26.1 | 28.6 |
| EBITDA, % | 5.52 | 6.25 | 2.58 | 11.69 | -5.17 | 4.17 | 4.17 | 4.17 | 4.17 | 4.17 |
| Depreciation | 1.8 | 2.4 | 2.5 | 2.8 | 8.2 | 4.1 | 4.5 | 5.0 | 5.5 | 6.0 |
| Depreciation, % | 0.55481 | 0.64204 | 0.61124 | 0.65516 | 1.9 | 0.87338 | 0.87338 | 0.87338 | 0.87338 | 0.87338 |
| EBIT | 16.2 | 21.0 | 8.1 | 47.6 | -30.3 | 15.5 | 17.1 | 18.8 | 20.6 | 22.6 |
| EBIT, % | 4.97 | 5.6 | 1.97 | 11.03 | -7.08 | 3.3 | 3.3 | 3.3 | 3.3 | 3.3 |
| Total Cash | 87.6 | 119.6 | 129.1 | 125.3 | 88.8 | 131.9 | 144.9 | 159.2 | 174.9 | 192.2 |
| Total Cash, percent | .0 | .0 | .0 | .0 | .0 | .0 | .0 | .0 | .0 | .0 |
| Account Receivables | 117.9 | 135.4 | 116.1 | 122.7 | 133.6 | 150.9 | 165.8 | 182.2 | 200.1 | 219.9 |
| Account Receivables, % | 36.09 | 36.17 | 28.34 | 28.43 | 31.17 | 32.04 | 32.04 | 32.04 | 32.04 | 32.04 |
| Inventories | 14.3 | 15.4 | 17.6 | .0 | .0 | 12.0 | 13.2 | 14.5 | 16.0 | 17.5 |
| Inventories, % | 4.36 | 4.11 | 4.31 | 0 | 0 | 2.56 | 2.56 | 2.56 | 2.56 | 2.56 |
| Accounts Payable | 3.2 | 5.7 | 8.0 | 6.0 | 5.3 | 6.7 | 7.3 | 8.1 | 8.9 | 9.7 |
| Accounts Payable, % | 0.9918 | 1.52 | 1.96 | 1.39 | 1.23 | 1.42 | 1.42 | 1.42 | 1.42 | 1.42 |
| Capital Expenditure | -1.5 | -2.1 | -4.3 | -7.2 | -3.4 | -4.3 | -4.7 | -5.2 | -5.7 | -6.2 |
| Capital Expenditure, % | -0.45382 | -0.56299 | -1.06 | -1.67 | -0.78787 | -0.90666 | -0.90666 | -0.90666 | -0.90666 | -0.90666 |
| Tax Rate, % | 1.01 | 1.01 | 1.01 | 1.01 | 1.01 | 1.01 | 1.01 | 1.01 | 1.01 | 1.01 |
| EBITAT | 10.7 | 81.2 | -5.3 | 30.1 | -30.0 | 10.2 | 11.2 | 12.3 | 13.5 | 14.9 |
| Depreciation | ||||||||||
| Changes in Account Receivables | ||||||||||
| Changes in Inventories | ||||||||||
| Changes in Accounts Payable | ||||||||||
| Capital Expenditure | ||||||||||
| UFCF | -117.9 | 65.3 | 12.4 | 34.7 | -36.9 | -17.9 | -4.4 | -4.8 | -5.3 | -5.8 |
| WACC, % | 8.24 | 8.72 | 7.31 | 8.2 | 8.71 | 8.24 | 8.24 | 8.24 | 8.24 | 8.24 |
| PV UFCF | ||||||||||
| SUM PV UFCF | -31.8 | |||||||||
| Long Term Growth Rate, % | 3.00 | |||||||||
| Free cash flow (T + 1) | -6 | |||||||||
| Terminal Value | -114 | |||||||||
| Present Terminal Value | -77 | |||||||||
| Enterprise Value | -109 | |||||||||
| Net Debt | 8 | |||||||||
| Equity Value | -117 | |||||||||
| Diluted Shares Outstanding, MM | 91 | |||||||||
| Equity Value Per Share | -1.29 |
What You Will Receive
- Comprehensive Financial Model: Rimini Street’s actual data provides an accurate DCF valuation.
- Complete Forecast Control: Modify revenue growth, profit margins, WACC, and other essential factors.
- Real-Time Calculations: Automatic updates allow you to view results instantly as you make adjustments.
- Professional-Grade Template: A polished Excel file crafted for high-quality valuation.
- Flexible and Reusable: Designed for adaptability, enabling repeated use for in-depth forecasts.
Key Features
- Comprehensive DCF Calculator: Features detailed unlevered and levered DCF valuation models tailored for Rimini Street, Inc. (RMNI).
- WACC Calculator: Includes a pre-built Weighted Average Cost of Capital sheet with adjustable inputs specific to RMNI.
- Customizable Forecast Assumptions: Easily modify growth rates, capital expenditures, and discount rates for accurate projections.
- Integrated Financial Ratios: Evaluate profitability, leverage, and efficiency ratios pertinent to Rimini Street, Inc. (RMNI).
- Interactive Dashboard and Charts: Visual representations summarize essential valuation metrics for straightforward analysis.
How It Works
- Download: Obtain the comprehensive Excel file featuring Rimini Street, Inc.'s (RMNI) financial data.
- Customize: Modify projections, including revenue growth rates, EBITDA percentages, and WACC.
- Update Automatically: The intrinsic value and NPV calculations refresh in real-time.
- Test Scenarios: Develop various forecasts and instantly compare the results.
- Make Decisions: Leverage the valuation insights to shape your investment approach.
Why Choose This Calculator for Rimini Street, Inc. (RMNI)?
- Accuracy: Utilizes authentic Rimini Street financial data for precise calculations.
- Flexibility: Allows users to easily adjust and experiment with various inputs.
- Time-Saving: Eliminate the need to create a financial model from the ground up.
- Professional-Grade: Crafted with the expertise and usability expected at the CFO level.
- User-Friendly: Intuitive interface designed for users of all financial backgrounds.
Who Should Use This Product?
- IT Managers: Optimize enterprise software investments and enhance system performance.
- Corporate Executives: Evaluate cost-saving strategies for software maintenance and support.
- Consultants and Advisors: Offer clients expert guidance on third-party support solutions for Rimini Street, Inc. (RMNI).
- Students and Educators: Explore real-world applications of software support models in academic settings.
- Business Analysts: Analyze market trends and competitive advantages in the enterprise software industry.
What the Template Contains
- Preloaded RMNI Data: Historical and projected financial data, including revenue, EBIT, and capital expenditures.
- DCF and WACC Models: Professional-grade sheets for calculating intrinsic value and Weighted Average Cost of Capital.
- Editable Inputs: Yellow-highlighted cells for adjusting revenue growth, tax rates, and discount rates.
- Financial Statements: Comprehensive annual and quarterly financials for deeper analysis.
- Key Ratios: Profitability, leverage, and efficiency ratios to evaluate performance.
- Dashboard and Charts: Visual summaries of valuation outcomes and assumptions.
Disclaimer
All information, articles, and product details provided on this website are for general informational and educational purposes only. We do not claim any ownership over, nor do we intend to infringe upon, any trademarks, copyrights, logos, brand names, or other intellectual property mentioned or depicted on this site. Such intellectual property remains the property of its respective owners, and any references here are made solely for identification or informational purposes, without implying any affiliation, endorsement, or partnership.
We make no representations or warranties, express or implied, regarding the accuracy, completeness, or suitability of any content or products presented. Nothing on this website should be construed as legal, tax, investment, financial, medical, or other professional advice. In addition, no part of this site—including articles or product references—constitutes a solicitation, recommendation, endorsement, advertisement, or offer to buy or sell any securities, franchises, or other financial instruments, particularly in jurisdictions where such activity would be unlawful.
All content is of a general nature and may not address the specific circumstances of any individual or entity. It is not a substitute for professional advice or services. Any actions you take based on the information provided here are strictly at your own risk. You accept full responsibility for any decisions or outcomes arising from your use of this website and agree to release us from any liability in connection with your use of, or reliance upon, the content or products found herein.