
|
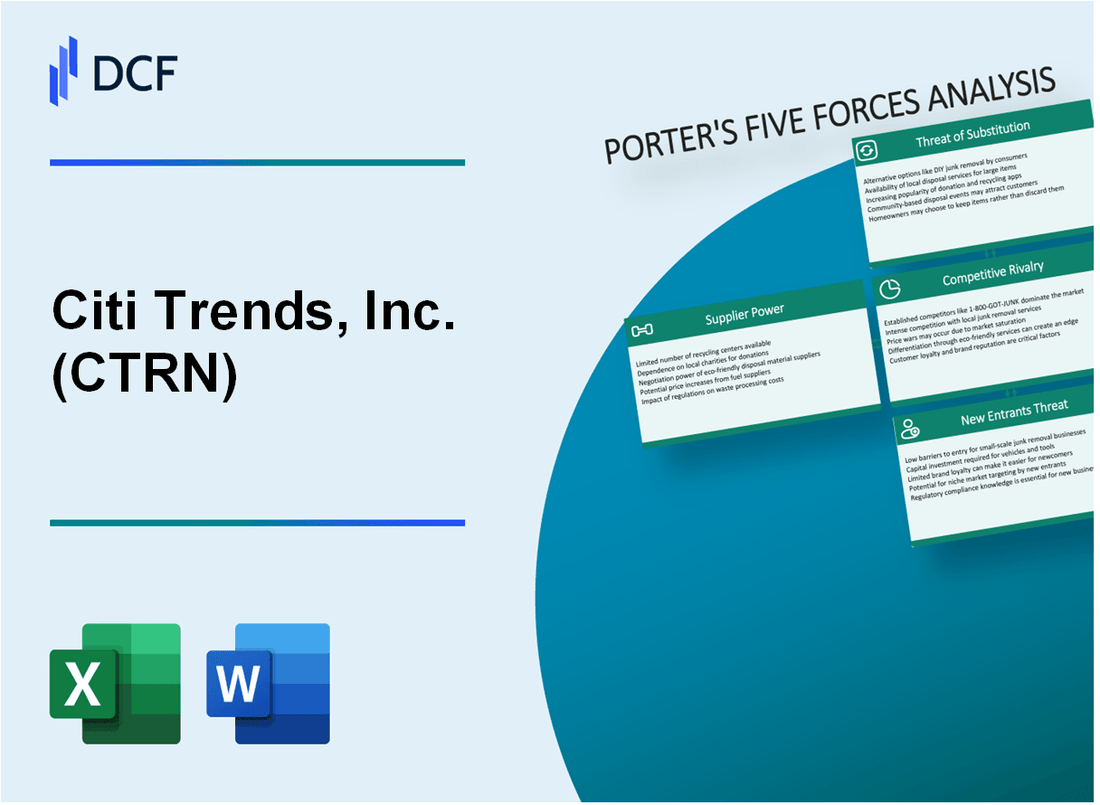
Citi Trends, Inc. (CTRN): 5 FORCES Analysis [Nov-2025 Updated] |
Fully Editable: Tailor To Your Needs In Excel Or Sheets
Professional Design: Trusted, Industry-Standard Templates
Investor-Approved Valuation Models
MAC/PC Compatible, Fully Unlocked
No Expertise Is Needed; Easy To Follow
Citi Trends, Inc. (CTRN) Bundle
As a former head analyst, I know you need the straight facts on where Citi Trends, Inc. stands right now, heading into late 2025. We've mapped out the five core pressures-from the extremely high rivalry in the off-price space to the low power of their suppliers who are selling inventory at up to 75% off MSRP. While customers hold significant price power given the average household income around $38K, the company's niche focus is clearly paying off, evidenced by the projected $7 million to $11 million EBITDA for fiscal 2025. Dive in below to see exactly how these forces shape the investment thesis for Citi Trends, Inc.
Citi Trends, Inc. (CTRN) - Porter's Five Forces: Bargaining power of suppliers
You're looking at Citi Trends, Inc.'s supplier dynamics, and honestly, the power here leans heavily toward the retailer. The core of the off-price model is exploiting supplier overstock, which inherently keeps supplier power low.
The power is low because Citi Trends buys opportunistic excess inventory at steep discounts. While I don't have a specific, publicly reported percentage for the maximum discount off MSRP for the entire period leading up to late 2025, the success of this strategy is visible in the financial results. For instance, the gross margin in the first quarter of fiscal 2025 reached 39.6%. This margin performance is directly supported by aggressive buying, as evidenced by the 45% decrease in aged inventory by the end of Q1 2025.
The off-price model relies on a large, fragmented pool of vendors needing to liquidate surplus stock. Citi Trends supports its nearly 600 stores and two distribution centers with this inventory flow. This reliance on a wide base of vendors who need to move goods quickly prevents any single supplier from gaining significant leverage.
To improve buying discipline and speed, Citi Trends is implementing an AI-based allocation system in 2025, partnering with Invent.AI. This technology is designed to optimize stock allocation and replenishment, which, in turn, strengthens the retailer's position by ensuring better inventory freshness and reducing the need for costly, last-minute buys from less favorable terms.
Management demonstrated successful cost control in the first quarter of 2025. They reported that teams have successfully held net product costs flat in aggregate for Q1 2025 by sourcing alternative goods when needed and capitalizing on off-price opportunities created by the disrupted environment. This flat cost structure, achieved while comparable store sales grew 9.9% in Q1 2025, shows buying power is strong.
Still, suppliers must adhere to strict compliance and ethical sourcing standards. Citi Trends requires suppliers to provide written certification confirming they and their subcontractors do not engage in slavery or human trafficking, aligning with requirements like the California Supply Chains Act. Failure to meet these standards can lead to corrective action, up to and including termination, which further limits supplier negotiation ability.
Here's a quick look at how inventory management metrics in Q1 2025 reflect this buying discipline:
| Metric | Q1 2025 Value | Comparison to Q1 2024 |
| Gross Margin Rate | 39.6% | Up 90 basis points |
| Merchandise Inventory (Total Dollars) | $109.9 million | Decreased 7.6% |
| Average In-Store Inventory | N/A | Decreased 4.9% year-over-year |
| Aged Product Reduction | N/A | 45% decrease |
| Share Repurchases Spend | $6.3 million | In Q1 2025 |
The ability to reduce overall inventory dollars by 7.6% while simultaneously growing sales by 8.3% in Q1 2025 is a clear indicator that Citi Trends is managing its inflow and outflow effectively, putting pressure on vendors to meet their terms. Finance: draft the Q3 2025 inventory purchase plan variance analysis by next Tuesday.
Citi Trends, Inc. (CTRN) - Porter's Five Forces: Bargaining power of customers
You're analyzing the customer power for Citi Trends, Inc. (CTRN), and honestly, it's a tightrope walk between high price sensitivity and strong community stickiness. Let's look at the raw numbers driving this dynamic.
The power leans high because the core customer base is extremely sensitive to price. Based on historical data for shoppers in these underserved communities, the average household income sits around $38K. That income level means every dollar counts, making the value proposition paramount. When customers are this budget-conscious, they are always looking for the best deal, which naturally gives them leverage.
Also, switching costs aren't high here. Customers can easily pivot to other value-focused retailers-think of the big-box off-price stores-for comparable apparel, accessories, or home goods. If Citi Trends, Inc. misses on trend or price, that customer traffic can walk out the door to a competitor without much friction.
Still, Citi Trends, Inc. has built some real defenses against this power. Customer loyalty and visit frequency act as a strong counterweight. We see evidence of this stickiness, with historical data showing over 40% of customers visiting more than 25 times per year. That's nearly every other week, which is defintely high-frequency shopping behavior for a retailer.
The company's deliberate niche focus on the African American family demographic is key to this mitigation. This focus fosters a strong, sticky community environment where the product assortment is curated specifically for their style and trend sensibilities. This cultural relevance makes the offering feel less like a generic discount store and more like a dedicated destination.
This strategy is clearly working on the top line. For the second quarter of fiscal 2025, comparable store sales grew by 9.2% compared to Q2 2024. Management noted that the majority of sales growth over the past four quarters has been driven by increased customer traffic and transactions. Year-to-date comparable store sales growth for the first half of fiscal 2025 was 9.6%. At the end of Q2 FY2025, the chain operated 590 locations.
Here's a quick look at some of the key customer and performance metrics we are tracking:
| Metric | Value | Period/Context |
| Average Customer Household Income (Historical Reference) | $38K | Reference for Core Customer Price Sensitivity |
| Q2 2025 Comparable Store Sales Growth | 9.2% | Compared to Q2 2024 |
| Year-to-Date Comparable Store Sales Growth | 9.6% | First Half of Fiscal 2025 |
| Store Count | 590 | End of Q2 FY2025 |
| Gross Margin Rate | 40.0% | Q2 2025 |
The high frequency suggests that even if the initial purchase isn't massive, the sheer volume of visits provides a buffer against competitors. For context on general loyalty behavior in 2025, we see that:
- Loyalty program members generate 12-18% more incremental revenue generally.
- 81% of free loyalty program members report they buy from that brand more frequently.
- 59% of consumers say they use their loyalty programs 1-3 times in a typical week.
- Customers emotionally connected to a brand are worth 306% more.
Citi Trends, Inc. (CTRN) - Porter's Five Forces: Competitive rivalry
You're analyzing a sector where every dollar counts, and the competition for the value-conscious shopper is fierce. The competitive rivalry within the off-price sector is, frankly, extremely high as of late 2025. This segment is thriving, which only draws more aggressive tactics from established players.
Direct competition comes from national giants that have massive scale and deep sourcing power. We're talking about The TJX Companies, which operates T.J. Maxx and Marshalls, and Burlington Stores, Inc. These competitors are actively expanding their physical footprints, which puts pressure on Citi Trends, Inc.'s market share. For instance, as of the end of second-quarter fiscal 2026 (which ended August 2, 2025), The TJX Companies operated 5,134 stores globally. Burlington Stores, Inc. executed 23 net new store additions in its second quarter of fiscal 2025, bringing its fleet to 1,138 locations at that quarter-end.
The overall off-price market size itself confirms the battleground's value: it is projected to reach \$372.46 billion in 2025. That's a huge pool of dollars everyone is fighting over.
Here's a quick look at how the major players are positioning their physical presence:
| Retailer | Store Count (Latest Reported as of Mid-2025) | Recent Comp Sales Growth Example |
|---|---|---|
| The TJX Companies (Marmaxx) | 5,134 (Global as of Q2 FY2026) | Comp sales rose 5% in Q3 2025 |
| Burlington Stores, Inc. | 1,138 (U.S. as of Q2 FY2025) | Comp sales growth of 1% in Q3 2025 |
| Citi Trends, Inc. (CTRN) | 591 (As of May 3, 2025) | Comp sales growth of 9.6% in Q2 2025 |
Still, Citi Trends, Inc. maintains a unique, defensible niche. It is, by its own description, the only off-price retailer specifically focused on the African American consumer. This targeted approach allows for a deep understanding of style preferences and budgetary needs within that core demographic. In the past, this core customer base was described as predominantly African American and Latinx households, representing about 84% of the customer base, with a median household income in the range of \$35,000 - \$55,000. This specialization is a key differentiator against the broader appeal of TJX Companies and Burlington Stores.
The positive momentum from this focused strategy is reflected in the financial guidance, showing a positive turnaround in what is clearly a tough, competitive market. The company's full year 2025 EBITDA is expected to be in the range of \$7 million to \$11 million. That's a significant swing when you look at the prior year's performance, which included an Adjusted EBITDA loss of \$18.0 million in Q2 2024 or a full-year Adjusted EBITDA loss of \$14.2 million for fiscal 2024.
The competitive pressures manifest in several ways for Citi Trends, Inc.:
- Direct comparison on comp sales against larger rivals.
- Need to maintain inventory freshness against giants with bigger buying power.
- Vulnerability of its core customer base to macro pressures like inflation.
- The necessity to continually reinforce its cultural relevance.
The success of the strategy is evident in recent operational metrics:
- Q2 2025 Comparable Store Sales Growth was 9.2%.
- Q1 2025 Comparable Store Sales Growth reached 9.9%.
- Gross Margin Rate for Q2 2025 climbed to 40.0%.
The rivalry is intense, but Citi Trends, Inc.'s niche focus provides a specific buffer against the broad market competition.
Citi Trends, Inc. (CTRN) - Porter's Five Forces: Threat of substitutes
You're analyzing the competitive forces facing Citi Trends, Inc. as we head into late 2025, and the threat from substitutes is definitely a key area to watch. Honestly, the sheer variety of ways a customer can spend their apparel dollar outside of a traditional off-price store is growing more complex every quarter.
The threat from online fast fashion brands and general e-commerce platforms is assessed as moderate to high. These digital-native competitors are agile, trend-focused, and often have lower overheads, which pressures the value proposition of brick-and-mortar players like Citi Trends, Inc. For context, the broader US eCommerce sales are projected to hit $1.29 trillion by the end of 2025.
The shift in how consumers shop for value is clear when you look at the off-price segment itself. Online sales are the fastest-growing part of that market, accounting for approximately 30% of total off-price sales back in 2023. While we don't have the final 2025 figure yet, the trend suggests continued digital migration, even for value-seeking customers.
Here's a quick look at the scale of the competing segments:
| Substitute Category | Relevant Metric/Value | Year/Period | Source of Data |
|---|---|---|---|
| Fast Fashion Market Size | $161.7 billion | 2025 Projection | |
| Secondhand/Resale Apparel Market Share | 10% of Global Apparel Market | 2025 Expectation | |
| Online Sales in Off-Price Retail | 30% of Total Sales | 2023 Figure | |
| Citi Trends, Inc. Store Count | 590 locations | Q2 Fiscal 2025 End |
The competition isn't just from new digital players, though. The circular economy is a major substitute force. Thrift stores, secondhand markets, and luxury consignment shops offer alternative deep-discount options that appeal to the increasingly sustainability-aware consumer. The resale market, for example, grew 18% in 2023 alone.
However, Citi Trends, Inc. has built-in defenses against pure online substitution. The physical store footprint remains a competitive advantage, especially for their core customer base who value immediate gratification and the tactile experience. The in-store treasure-hunt experience and neighborhood convenience of the 590 stores serve as a barrier to pure online substitution.
You can see the appeal of the physical experience reflected in their recent results, which shows the strategy is working to pull customers in:
- Comparable store sales growth for Q2 Fiscal 2025 was 9.2%.
- Year-to-date comparable store sales growth through Q2 Fiscal 2025 was 9.6%.
- The company is actively remodeling stores, planning to remodel approximately 50 stores in 2025.
- The company ended Q2 2025 with $50.4 million in cash and no debt, giving it flexibility to invest in the in-store experience.
If onboarding for online competitors takes 14+ days, churn risk rises for customers seeking immediate, low-cost fashion fixes, which is where Citi Trends, Inc.'s physical presence helps.
Citi Trends, Inc. (CTRN) - Porter's Five Forces: Threat of new entrants
You're assessing barriers to entry in the off-price retail space, and for Citi Trends, Inc. (CTRN), the hurdles for a new competitor are substantial, leaning the threat toward low to moderate. The primary defense isn't just capital; it's the operational complexity of their model. New players can't just open stores; they need an established, complex opportunistic buying infrastructure to consistently source the deep discounts that define the value proposition. That takes time and connections, which are not easily bought off the shelf.
Consider the sheer physical footprint a rival would need to match. Citi Trends, Inc. already operates a network that is difficult and expensive to replicate quickly. This scale advantage acts as a significant deterrent against smaller, less capitalized entrants. To even approach parity, a new company would need to immediately fund the build-out of a store base exceeding the current 590 locations across 33 states.
Here's a quick look at the scale and financial muscle Citi Trends, Inc. brings to bear against potential rivals:
| Metric | Value (as of late 2025 data) | Significance to Barrier |
|---|---|---|
| Current Store Count | 590 locations | Requires massive initial capital outlay to match footprint. |
| Geographic Footprint | 33 states | Indicates established national logistics and brand recognition. |
| Cash on Hand (Q2 2025) | $50.4 million | Provides a strong financial buffer against capital-intensive rivals. |
| Total Debt (Q2 2025) | $0 | Maximum financial flexibility for defense or strategic investment. |
| Planned FY 2025 CapEx | Up to $25 million | Reinforces scale advantage through store remodels and new openings. |
That strong balance sheet is a key defensive moat. As of the second quarter of fiscal 2025, Citi Trends, Inc. held $50.4 million in cash and carried absolutely no debt. This financial posture means they can weather competitive pricing wars or fund their own expansion/remodel plans without the immediate pressure of servicing debt, something a startup would certainly face. It's defintely a solid foundation.
Beyond the numbers, the core of the business is deeply embedded in its customer base. The specialized focus on the African American consumer requires deep cultural and merchandising knowledge that is incredibly hard to replicate quickly. New entrants must understand the specific 'Cultural Cachet' that drives purchasing decisions, which is not something you can learn from a textbook. This specialized knowledge translates directly into inventory productivity.
The ongoing investment in the existing fleet further solidifies this advantage. Citi Trends, Inc. is reinforcing its physical presence and customer experience through strategic spending. This commitment to the store base is visible in their planned capital expenditures for 2025:
- Remodel approximately 60 stores to the updated format.
- Plan to open up to 3 new stores.
- Plan to close up to 3 locations, optimizing the fleet.
- Total planned capital expenditures for the year are between $22 million and $25 million.
This continuous investment in store modernization, coupled with the established supply chain for opportunistic buying, creates a high-cost, high-risk proposition for any company thinking about entering this specific value segment. Finance: draft 13-week cash view by Friday.
Disclaimer
All information, articles, and product details provided on this website are for general informational and educational purposes only. We do not claim any ownership over, nor do we intend to infringe upon, any trademarks, copyrights, logos, brand names, or other intellectual property mentioned or depicted on this site. Such intellectual property remains the property of its respective owners, and any references here are made solely for identification or informational purposes, without implying any affiliation, endorsement, or partnership.
We make no representations or warranties, express or implied, regarding the accuracy, completeness, or suitability of any content or products presented. Nothing on this website should be construed as legal, tax, investment, financial, medical, or other professional advice. In addition, no part of this site—including articles or product references—constitutes a solicitation, recommendation, endorsement, advertisement, or offer to buy or sell any securities, franchises, or other financial instruments, particularly in jurisdictions where such activity would be unlawful.
All content is of a general nature and may not address the specific circumstances of any individual or entity. It is not a substitute for professional advice or services. Any actions you take based on the information provided here are strictly at your own risk. You accept full responsibility for any decisions or outcomes arising from your use of this website and agree to release us from any liability in connection with your use of, or reliance upon, the content or products found herein.