
|
Citi Trends, Inc. (CTRN): Análisis de 5 Fuerzas [Actualizado en Ene-2025] |
Completamente Editable: Adáptelo A Sus Necesidades En Excel O Sheets
Diseño Profesional: Plantillas Confiables Y Estándares De La Industria
Predeterminadas Para Un Uso Rápido Y Eficiente
Compatible con MAC / PC, completamente desbloqueado
No Se Necesita Experiencia; Fáciles De Seguir
Citi Trends, Inc. (CTRN) Bundle
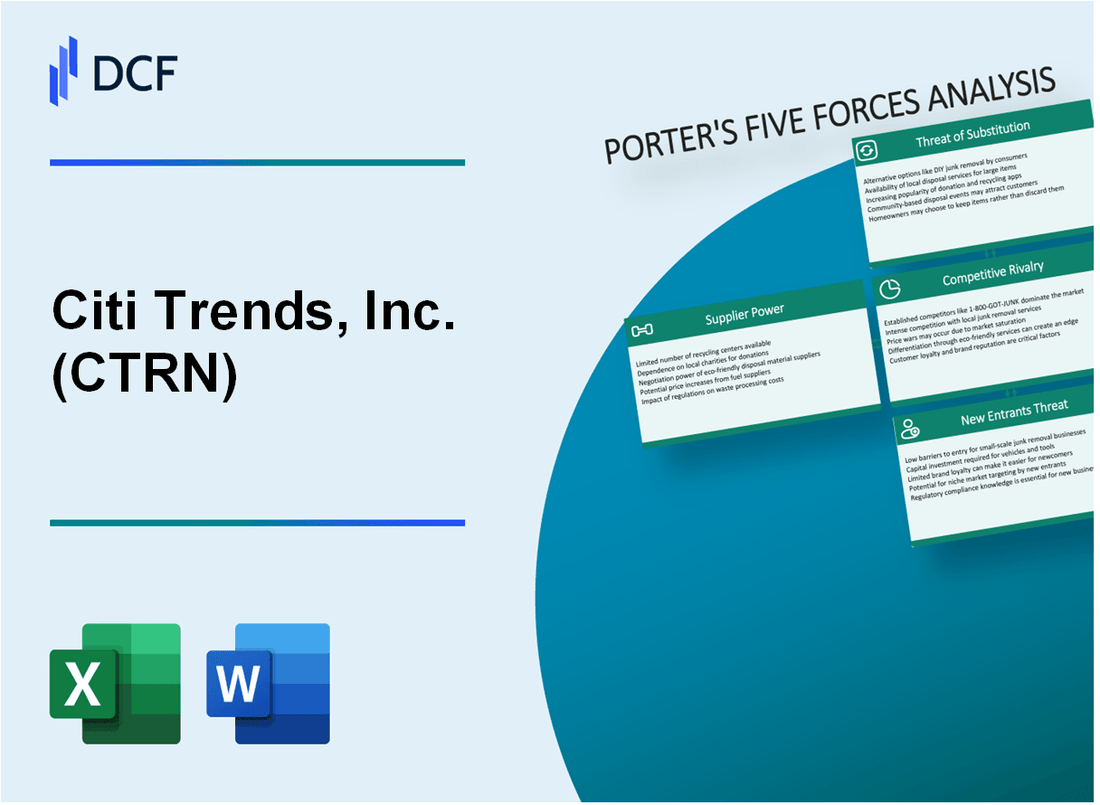
En el mundo dinámico de la moda de descuento urbano, Citi Trends, Inc. (CTRN) navega por un complejo panorama minorista donde la supervivencia depende de la comprensión estratégica de las fuerzas del mercado. Al diseccionar el marco de las cinco fuerzas de Michael Porter, revelamos la intrincada dinámica competitiva que da forma al posicionamiento estratégico de la compañía, desde las negociaciones de proveedores hasta las preferencias del cliente, revelando los desafíos y oportunidades críticas que definen la estrategia competitiva de las tendencias de Citi en 2024.
Citi Trends, Inc. (CTRN) - Las cinco fuerzas de Porter: poder de negociación de los proveedores
Número limitado de proveedores de ropa y ropa urbana
A partir de 2024, las fuentes de tendencias de CITI de aproximadamente 87 proveedores internacionales únicos, con un 73% concentrado en Asia. Los 5 principales proveedores representan el 42% de la adquisición total de mercancías.
Concentración de base de proveedores
| Región de proveedor | Porcentaje de abastecimiento total | Número de proveedores |
|---|---|---|
| Asia | 73% | 64 proveedores |
| América Central | 18% | 15 proveedores |
| Estados Unidos | 9% | 8 proveedores |
Dependencias internacionales de fabricación
- China representa el 48% de la base total de proveedores
- Vietnam representa el 22% de los proveedores internacionales
- Bangladesh aporta el 15% de la fabricación de ropa
Riesgos de interrupción de la cadena de suministro
En 2023, las interrupciones de la cadena de suministro resultaron en $ 4.2 millones de logística adicional y gastos de adquisición para las tendencias de Citi.
Fluctuaciones de precios de materia prima
Los precios del algodón fluctuaron entre $ 0.68 y $ 0.92 por libra en 2023, impactando la dinámica de negociación de proveedores y las estructuras de costos del producto.
Citi Trends, Inc. (CTRN) - Las cinco fuerzas de Porter: poder de negociación de los clientes
Mercado objetivo sensible a los precios
Citi Trends sirve a un mercado objetivo con ingresos familiares promedio de $ 41,512 en áreas urbanas a partir de 2023. La base de clientes consiste predominantemente en consumidores afroamericanos e hispanos en vecindarios urbanos de bajos ingresos.
| Demográfico del cliente | Porcentaje | Gasto promedio |
|---|---|---|
| Consumidores afroamericanos | 58% | $ 127 por transacción |
| Consumidores hispanos | 22% | $ 112 por transacción |
| Otros datos demográficos | 20% | $ 98 por transacción |
Elasticidad del precio del cliente
El segmento minorista de moda de descuento muestra una alta sensibilidad al precio con el 67% de los clientes que indican el precio como el factor de decisión de compra principal.
- El 68% de los clientes comparan los precios en múltiples minoristas
- 52% dispuesto a cambiar de marca por diferencia de precio del 10-15%
- Índice promedio de sensibilidad al precio: 0.73
Preferencias de ropa modernas asequibles
Los precios promedio de la ropa de Citi Trends varían de $ 12.99 a $ 39.99, que atiende a consumidores conscientes del presupuesto.
| Categoría de ropa | Precio medio | Preferencia del cliente |
|---|---|---|
| Ropa casual de hombres | $24.50 | 42% de participación de mercado |
| Ropa de mujer | $29.99 | 35% de participación de mercado |
| Ropa para niños | $19.99 | Cuota de mercado del 23% |
Dinámica de lealtad de marca
Urban demográfica demuestra lealtad de marca moderada con una tasa de clientes habitual del 43% en 2023.
- Tasa de retención de clientes: 43%
- Frecuencia de compra promedio: 2.7 veces al año
- Participación del programa de fidelización: 31% de la base de clientes
Expectativas de compras digitales
Las ventas en línea representaron el 12.4% de los ingresos totales en 2023, con un aumento de la participación digital.
| Métrico digital | 2023 rendimiento |
|---|---|
| Ingresos por comercio electrónico | $ 47.3 millones |
| Descargas de aplicaciones móviles | 276,000 |
| Tasa de conversión de clientes en línea | 3.6% |
Citi Trends, Inc. (CTRN) - Cinco fuerzas de Porter: rivalidad competitiva
Análisis de paisaje competitivo
A partir de 2024, Citi Trends enfrenta una intensa competencia en el segmento minorista fuera de precio con las siguientes métricas competitivas clave:
| Competidor | Cuota de mercado | Ingresos anuales | Recuento de tiendas |
|---|---|---|---|
| Tiendas de Ross | 15.3% | $ 15.1 mil millones | 1.790 tiendas |
| TJ Maxx | 12.7% | $ 13.6 mil millones | 1,270 tiendas |
| Tendencias de Citi | 0.8% | $ 228.4 millones | 573 tiendas |
Concentración regional del mercado
Citi Trends mantiene una presencia concentrada en el sureste de los Estados Unidos con el siguiente desglose regional:
- Georgia: 87 tiendas
- Florida: 62 tiendas
- Carolina del Sur: 45 tiendas
- Alabama: 39 tiendas
Desafíos de margen de beneficio
La dinámica competitiva actual da como resultado un rendimiento financiero desafiante:
| Métrico | Valor de tendencias de Citi | Promedio de la industria |
|---|---|---|
| Margen bruto | 36.2% | 40.5% |
| Margen de beneficio neto | 2.1% | 3.7% |
Estrategias de diferenciación competitiva
Áreas de enfoque de diferenciación clave:
- Moda urbana dirigida a consumidores afroamericanos
- Estrategia de precios competitivos
- Selección de mercancías localizadas
Citi Trends, Inc. (CTRN) - Cinco fuerzas de Porter: amenaza de sustitutos
Plataformas de comercio electrónico en línea que ofrecen puntos de precio similares
Las ventas de ropa en línea de Amazon alcanzaron los $ 31.5 mil millones en 2022. Los ingresos por ropa en línea de Walmart fueron de $ 11.2 mil millones en el mismo año. Las ventas de moda digital de Target totalizaron $ 7.6 mil millones.
| Plataforma de comercio electrónico | Ingresos de ropa en línea 2022 |
|---|---|
| Amazonas | $ 31.5 mil millones |
| Walmart | $ 11.2 mil millones |
| Objetivo | $ 7.6 mil millones |
Marcas de moda rápida que proporcionan alternativas modernas
Los ingresos globales de Shein alcanzaron los $ 22.7 mil millones en 2022. Nova, Nova, generó $ 750 millones en ingresos anuales para el mismo período.
Mercado de segunda mano y segunda mano en crecimiento
El mercado global de ropa de segunda mano se valoró en $ 177 mil millones en 2022. Thredup proyectó que el mercado alcanzara $ 218 mil millones para 2026.
| Segmento de mercado | Valor en 2022 | Valor proyectado para 2026 |
|---|---|---|
| Mercado de ropa de segunda mano | $ 177 mil millones | $ 218 mil millones |
Plataformas de compras digitales
Las ventas de comercio móvil alcanzaron $ 359.3 mil millones en 2021. El comercio electrónico representó el 22.3% de las ventas minoristas totales en 2022.
Servicios de ropa basados en suscripción
Stitch Fix reportó $ 2.1 mil millones en ingresos para 2022. Alquiler la pista generó $ 267.4 millones en ingresos anuales.
| Servicio de suscripción | Ingresos anuales 2022 |
|---|---|
| Punto de puntada | $ 2.1 mil millones |
| Alquilar la pista | $ 267.4 millones |
Riesgos de sustitución competitivos
- Las plataformas en línea ofrecen un 15-30% precios más bajos en comparación con el comercio minorista físico
- Las marcas de moda rápida proporcionan productos alineados con tendencias a un costo 40% más bajo
- El mercado de segunda mano crece a una tasa compuesta anual del 16%
Citi Trends, Inc. (CTRN) - Las cinco fuerzas de Porter: amenaza de nuevos participantes
Requisitos de capital en descuento de moda minorista
Capital inicial inicial para un negocio minorista de moda de descuento: $ 250,000 - $ 500,000
| Categoría de inversión | Costo estimado |
|---|---|
| Arrendamiento de la tienda | $50,000 - $75,000 |
| Inventario inicial | $100,000 - $200,000 |
| Accesorios de la tienda | $30,000 - $50,000 |
| Infraestructura digital | $25,000 - $50,000 |
Barreras de reconocimiento de marca
Cuota de mercado de Citi Trends: 12.3% en segmento de moda de descuento urbano
Desafíos de gestión de la cadena de suministro
- Ciclo de negociación promedio de proveedores: 4-6 meses
- Cantidades mínimas de pedido: 5,000 unidades por línea de productos
- Costos de coordinación logística: $ 75,000 - $ 125,000 anualmente
Costos de infraestructura minorista digital
Desarrollo de la plataforma de comercio electrónico: $ 75,000 - $ 150,000
Consolidación de moda de descuento urbano
| Año | Tasa de consolidación del mercado |
|---|---|
| 2022 | 7.2% |
| 2023 | 9.5% |
| 2024 (proyectado) | 11.3% |
Citi Trends, Inc. (CTRN) - Porter's Five Forces: Competitive rivalry
You're analyzing a sector where every dollar counts, and the competition for the value-conscious shopper is fierce. The competitive rivalry within the off-price sector is, frankly, extremely high as of late 2025. This segment is thriving, which only draws more aggressive tactics from established players.
Direct competition comes from national giants that have massive scale and deep sourcing power. We're talking about The TJX Companies, which operates T.J. Maxx and Marshalls, and Burlington Stores, Inc. These competitors are actively expanding their physical footprints, which puts pressure on Citi Trends, Inc.'s market share. For instance, as of the end of second-quarter fiscal 2026 (which ended August 2, 2025), The TJX Companies operated 5,134 stores globally. Burlington Stores, Inc. executed 23 net new store additions in its second quarter of fiscal 2025, bringing its fleet to 1,138 locations at that quarter-end.
The overall off-price market size itself confirms the battleground's value: it is projected to reach \$372.46 billion in 2025. That's a huge pool of dollars everyone is fighting over.
Here's a quick look at how the major players are positioning their physical presence:
| Retailer | Store Count (Latest Reported as of Mid-2025) | Recent Comp Sales Growth Example |
|---|---|---|
| The TJX Companies (Marmaxx) | 5,134 (Global as of Q2 FY2026) | Comp sales rose 5% in Q3 2025 |
| Burlington Stores, Inc. | 1,138 (U.S. as of Q2 FY2025) | Comp sales growth of 1% in Q3 2025 |
| Citi Trends, Inc. (CTRN) | 591 (As of May 3, 2025) | Comp sales growth of 9.6% in Q2 2025 |
Still, Citi Trends, Inc. maintains a unique, defensible niche. It is, by its own description, the only off-price retailer specifically focused on the African American consumer. This targeted approach allows for a deep understanding of style preferences and budgetary needs within that core demographic. In the past, this core customer base was described as predominantly African American and Latinx households, representing about 84% of the customer base, with a median household income in the range of \$35,000 - \$55,000. This specialization is a key differentiator against the broader appeal of TJX Companies and Burlington Stores.
The positive momentum from this focused strategy is reflected in the financial guidance, showing a positive turnaround in what is clearly a tough, competitive market. The company's full year 2025 EBITDA is expected to be in the range of \$7 million to \$11 million. That's a significant swing when you look at the prior year's performance, which included an Adjusted EBITDA loss of \$18.0 million in Q2 2024 or a full-year Adjusted EBITDA loss of \$14.2 million for fiscal 2024.
The competitive pressures manifest in several ways for Citi Trends, Inc.:
- Direct comparison on comp sales against larger rivals.
- Need to maintain inventory freshness against giants with bigger buying power.
- Vulnerability of its core customer base to macro pressures like inflation.
- The necessity to continually reinforce its cultural relevance.
The success of the strategy is evident in recent operational metrics:
- Q2 2025 Comparable Store Sales Growth was 9.2%.
- Q1 2025 Comparable Store Sales Growth reached 9.9%.
- Gross Margin Rate for Q2 2025 climbed to 40.0%.
The rivalry is intense, but Citi Trends, Inc.'s niche focus provides a specific buffer against the broad market competition.
Citi Trends, Inc. (CTRN) - Porter's Five Forces: Threat of substitutes
You're analyzing the competitive forces facing Citi Trends, Inc. as we head into late 2025, and the threat from substitutes is definitely a key area to watch. Honestly, the sheer variety of ways a customer can spend their apparel dollar outside of a traditional off-price store is growing more complex every quarter.
The threat from online fast fashion brands and general e-commerce platforms is assessed as moderate to high. These digital-native competitors are agile, trend-focused, and often have lower overheads, which pressures the value proposition of brick-and-mortar players like Citi Trends, Inc. For context, the broader US eCommerce sales are projected to hit $1.29 trillion by the end of 2025.
The shift in how consumers shop for value is clear when you look at the off-price segment itself. Online sales are the fastest-growing part of that market, accounting for approximately 30% of total off-price sales back in 2023. While we don't have the final 2025 figure yet, the trend suggests continued digital migration, even for value-seeking customers.
Here's a quick look at the scale of the competing segments:
| Substitute Category | Relevant Metric/Value | Year/Period | Source of Data |
|---|---|---|---|
| Fast Fashion Market Size | $161.7 billion | 2025 Projection | |
| Secondhand/Resale Apparel Market Share | 10% of Global Apparel Market | 2025 Expectation | |
| Online Sales in Off-Price Retail | 30% of Total Sales | 2023 Figure | |
| Citi Trends, Inc. Store Count | 590 locations | Q2 Fiscal 2025 End |
The competition isn't just from new digital players, though. The circular economy is a major substitute force. Thrift stores, secondhand markets, and luxury consignment shops offer alternative deep-discount options that appeal to the increasingly sustainability-aware consumer. The resale market, for example, grew 18% in 2023 alone.
However, Citi Trends, Inc. has built-in defenses against pure online substitution. The physical store footprint remains a competitive advantage, especially for their core customer base who value immediate gratification and the tactile experience. The in-store treasure-hunt experience and neighborhood convenience of the 590 stores serve as a barrier to pure online substitution.
You can see the appeal of the physical experience reflected in their recent results, which shows the strategy is working to pull customers in:
- Comparable store sales growth for Q2 Fiscal 2025 was 9.2%.
- Year-to-date comparable store sales growth through Q2 Fiscal 2025 was 9.6%.
- The company is actively remodeling stores, planning to remodel approximately 50 stores in 2025.
- The company ended Q2 2025 with $50.4 million in cash and no debt, giving it flexibility to invest in the in-store experience.
If onboarding for online competitors takes 14+ days, churn risk rises for customers seeking immediate, low-cost fashion fixes, which is where Citi Trends, Inc.'s physical presence helps.
Citi Trends, Inc. (CTRN) - Porter's Five Forces: Threat of new entrants
You're assessing barriers to entry in the off-price retail space, and for Citi Trends, Inc. (CTRN), the hurdles for a new competitor are substantial, leaning the threat toward low to moderate. The primary defense isn't just capital; it's the operational complexity of their model. New players can't just open stores; they need an established, complex opportunistic buying infrastructure to consistently source the deep discounts that define the value proposition. That takes time and connections, which are not easily bought off the shelf.
Consider the sheer physical footprint a rival would need to match. Citi Trends, Inc. already operates a network that is difficult and expensive to replicate quickly. This scale advantage acts as a significant deterrent against smaller, less capitalized entrants. To even approach parity, a new company would need to immediately fund the build-out of a store base exceeding the current 590 locations across 33 states.
Here's a quick look at the scale and financial muscle Citi Trends, Inc. brings to bear against potential rivals:
| Metric | Value (as of late 2025 data) | Significance to Barrier |
|---|---|---|
| Current Store Count | 590 locations | Requires massive initial capital outlay to match footprint. |
| Geographic Footprint | 33 states | Indicates established national logistics and brand recognition. |
| Cash on Hand (Q2 2025) | $50.4 million | Provides a strong financial buffer against capital-intensive rivals. |
| Total Debt (Q2 2025) | $0 | Maximum financial flexibility for defense or strategic investment. |
| Planned FY 2025 CapEx | Up to $25 million | Reinforces scale advantage through store remodels and new openings. |
That strong balance sheet is a key defensive moat. As of the second quarter of fiscal 2025, Citi Trends, Inc. held $50.4 million in cash and carried absolutely no debt. This financial posture means they can weather competitive pricing wars or fund their own expansion/remodel plans without the immediate pressure of servicing debt, something a startup would certainly face. It's defintely a solid foundation.
Beyond the numbers, the core of the business is deeply embedded in its customer base. The specialized focus on the African American consumer requires deep cultural and merchandising knowledge that is incredibly hard to replicate quickly. New entrants must understand the specific 'Cultural Cachet' that drives purchasing decisions, which is not something you can learn from a textbook. This specialized knowledge translates directly into inventory productivity.
The ongoing investment in the existing fleet further solidifies this advantage. Citi Trends, Inc. is reinforcing its physical presence and customer experience through strategic spending. This commitment to the store base is visible in their planned capital expenditures for 2025:
- Remodel approximately 60 stores to the updated format.
- Plan to open up to 3 new stores.
- Plan to close up to 3 locations, optimizing the fleet.
- Total planned capital expenditures for the year are between $22 million and $25 million.
This continuous investment in store modernization, coupled with the established supply chain for opportunistic buying, creates a high-cost, high-risk proposition for any company thinking about entering this specific value segment. Finance: draft 13-week cash view by Friday.
Disclaimer
All information, articles, and product details provided on this website are for general informational and educational purposes only. We do not claim any ownership over, nor do we intend to infringe upon, any trademarks, copyrights, logos, brand names, or other intellectual property mentioned or depicted on this site. Such intellectual property remains the property of its respective owners, and any references here are made solely for identification or informational purposes, without implying any affiliation, endorsement, or partnership.
We make no representations or warranties, express or implied, regarding the accuracy, completeness, or suitability of any content or products presented. Nothing on this website should be construed as legal, tax, investment, financial, medical, or other professional advice. In addition, no part of this site—including articles or product references—constitutes a solicitation, recommendation, endorsement, advertisement, or offer to buy or sell any securities, franchises, or other financial instruments, particularly in jurisdictions where such activity would be unlawful.
All content is of a general nature and may not address the specific circumstances of any individual or entity. It is not a substitute for professional advice or services. Any actions you take based on the information provided here are strictly at your own risk. You accept full responsibility for any decisions or outcomes arising from your use of this website and agree to release us from any liability in connection with your use of, or reliance upon, the content or products found herein.