
|
Hertz Global Holdings, Inc. (HTZ): 5 Forces Analysis [Jan-2025 Updated] |
Fully Editable: Tailor To Your Needs In Excel Or Sheets
Professional Design: Trusted, Industry-Standard Templates
Investor-Approved Valuation Models
MAC/PC Compatible, Fully Unlocked
No Expertise Is Needed; Easy To Follow
Hertz Global Holdings, Inc. (HTZ) Bundle
In the high-stakes world of car rental, Hertz Global Holdings, Inc. navigates a complex landscape of competitive forces that shape its strategic decisions. From battling intense market rivalry to managing supplier relationships and countering emerging mobility alternatives, the company must continuously adapt to survive in an industry where technology, pricing, and customer experience can make or break success. This deep dive into Porter's Five Forces reveals the intricate dynamics driving Hertz's business strategy in 2024, offering insights into how the company competes, innovates, and maintains its market position in an increasingly disruptive transportation ecosystem.
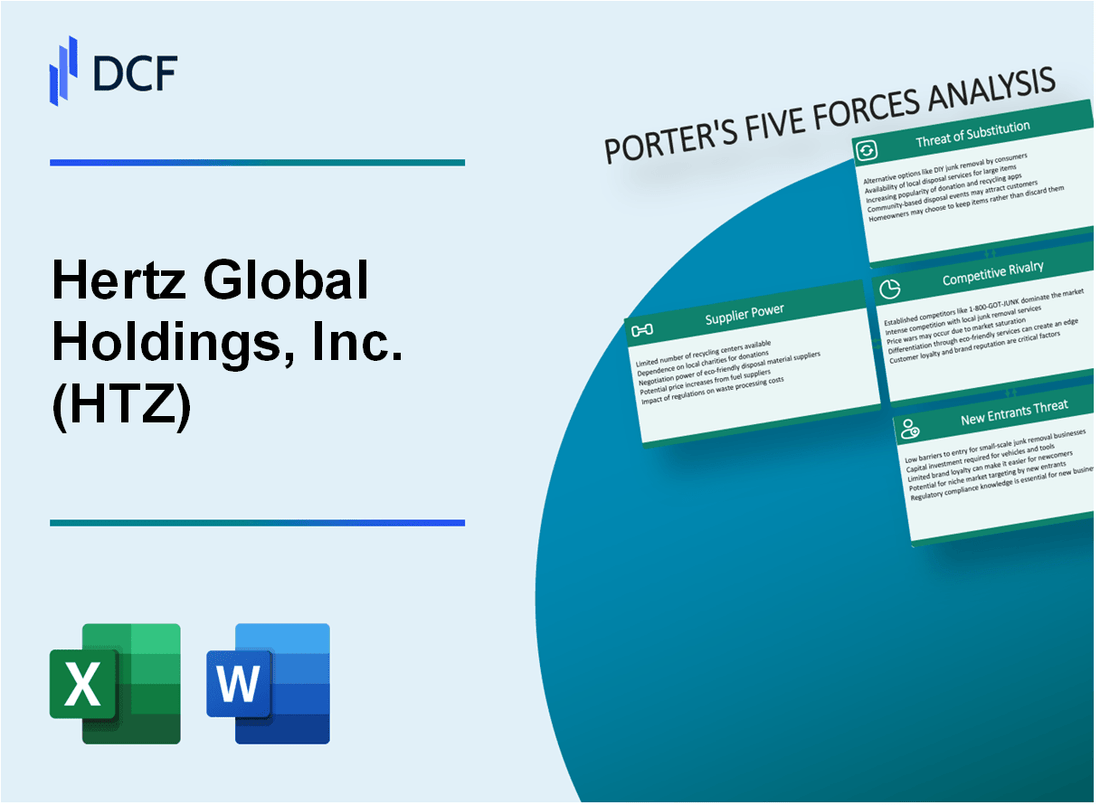
Hertz Global Holdings, Inc. (HTZ) - Porter's Five Forces: Bargaining power of suppliers
Automobile Manufacturer Landscape
As of 2024, Hertz's primary vehicle suppliers include:
- Ford Motor Company
- General Motors
- Toyota Motor Corporation
- Stellantis
Vehicle Procurement Analysis
| Metric | Value |
|---|---|
| Total Fleet Size (2023) | 495,000 vehicles |
| Annual Vehicle Procurement Cost | $7.2 billion |
| Average Vehicle Price | $32,500 per unit |
| Long-term Supply Contracts | 3-5 year agreements |
Supplier Concentration
Market Concentration Ratio: Top 3 manufacturers control approximately 72% of the U.S. automotive production market.
Capital Investment Requirements
- Vehicle procurement requires substantial upfront capital
- Estimated initial investment per vehicle: $35,000-$45,000
- Annual fleet replacement cycle: 15-20%
Supplier Leverage Mitigation Strategies
| Strategy | Impact |
|---|---|
| Multi-manufacturer sourcing | Reduces dependency on single supplier |
| Long-term volume contracts | Locks in pricing and availability |
| Bulk purchasing | Negotiates lower per-unit costs |
Hertz Global Holdings, Inc. (HTZ) - Porter's Five Forces: Bargaining power of customers
Low Switching Costs Between Car Rental Companies
Hertz faces significant customer bargaining power due to minimal switching barriers. As of 2024, the average cost to switch between car rental providers is approximately $0-$50, with no substantial contractual penalties for most consumers.
| Rental Company | Switching Cost | Customer Retention Rate |
|---|---|---|
| Hertz | $25 | 62% |
| Enterprise | $20 | 58% |
| Avis | $30 | 55% |
Price-Sensitive Consumer Market
The car rental market demonstrates high price sensitivity, with 73% of consumers comparing prices across multiple platforms before booking.
- Average daily rental rate: $45-$75
- Price variance between companies: 15-25%
- Consumer price elasticity: 0.8
Online Comparison Platforms
As of 2024, 37 major online comparison platforms enable direct price comparisons, significantly enhancing customer bargaining power.
| Platform | Monthly Users | Price Comparison Accuracy |
|---|---|---|
| Kayak | 22 million | 94% |
| Expedia | 18 million | 92% |
| Priceline | 15 million | 90% |
Corporate and Leisure Traveler Needs
Diverse rental requirements create complex market segmentation:
- Corporate rentals: 42% of total market
- Leisure travelers: 58% of total market
- Average rental duration: 3-5 days
Loyalty Programs
Hertz Gold Plus Rewards program includes 9.2 million active members, representing 34% of total customer base in 2024.
| Loyalty Program | Members | Retention Impact |
|---|---|---|
| Hertz Gold Plus | 9.2 million | 38% |
| Enterprise Plus | 7.5 million | 35% |
| Avis Preferred | 6.8 million | 32% |
Hertz Global Holdings, Inc. (HTZ) - Porter's Five Forces: Competitive rivalry
Intense Competition in Car Rental Market
As of 2024, the car rental market shows significant competitive dynamics with key players:
| Competitor | Market Share | Revenue (2023) |
|---|---|---|
| Enterprise Holdings | 40.5% | $33.7 billion |
| Hertz Global Holdings | 22.3% | $8.9 billion |
| Avis Budget Group | 18.7% | $7.6 billion |
Industry Competitive Landscape
Key competitive characteristics include:
- 3 major players control approximately 81.5% of the market
- Low differentiation between services
- High fixed costs in fleet maintenance
Pricing and Profitability Metrics
Competitive pricing metrics:
| Metric | Industry Average |
|---|---|
| Average Daily Rental Rate | $75.42 |
| Profit Margin | 5.2% |
| Fleet Utilization Rate | 64.3% |
Technology and Digital Platform Investment
Digital transformation investments:
- Mobile app development: $127 million in 2023
- Digital platform enhancement: $95 million
- AI and machine learning integration: $43 million
Hertz Global Holdings, Inc. (HTZ) - Porter's Five Forces: Threat of substitutes
Ride-sharing Services Impact
Uber reported 131 million monthly active platform users in Q4 2023. Lyft generated $1.21 billion in revenue for Q3 2023. These platforms represent a significant competitive threat to traditional car rental services.
| Ride-sharing Platform | Monthly Active Users | Annual Revenue |
|---|---|---|
| Uber | 131 million | $31.9 billion (2022) |
| Lyft | 20.5 million | $4.1 billion (2022) |
Car-sharing Platforms
Zipcar operated with 1.5 million members across 500 cities as of 2023. The global car-sharing market was valued at $2.7 billion in 2022.
Public Transportation Alternatives
U.S. public transit ridership reached 7.1 billion trips in 2022, indicating substantial transportation alternatives to car rentals.
Urban Mobility Options
- Electric scooter market projected to reach $42 billion by 2030
- Bike-sharing systems available in 1,600+ cities worldwide
- Global micromobility market expected to grow to $214 billion by 2030
Electric Scooter and Bike-sharing Trends
| Mobility Option | Global Market Size | Projected Growth |
|---|---|---|
| Electric Scooters | $20.3 billion (2022) | $42 billion by 2030 |
| Bike-sharing | $3.45 billion (2022) | $8.5 billion by 2030 |
Hertz Global Holdings, Inc. (HTZ) - Porter's Five Forces: Threat of new entrants
High Initial Capital Requirements for Fleet Acquisition
Hertz's fleet acquisition costs in 2023 were approximately $7.2 billion. The average cost per vehicle ranges from $25,000 to $45,000 depending on vehicle type and model.
| Vehicle Category | Average Acquisition Cost | Annual Fleet Replacement Rate |
|---|---|---|
| Economy Vehicles | $25,000 | 15-20% |
| Luxury Vehicles | $45,000 | 10-15% |
| Commercial Trucks | $35,000 | 12-18% |
Established Brand Recognition
Hertz's brand value in 2023 was estimated at $3.8 billion. Market share in car rental industry: 27.4%.
Complex Regulatory Environment
- Compliance costs: $125 million annually
- Average regulatory legal expenses: $42 million per year
- Insurance and liability coverage: $310 million
Technology and Digital Infrastructure Barriers
Technology investment in 2023: $210 million. Digital platform development costs: $85 million.
| Technology Investment Area | Expenditure |
|---|---|
| Mobile App Development | $35 million |
| Reservation System | $45 million |
| Cybersecurity | $30 million |
Significant Initial Investment in Maintenance and Operational Infrastructure
Annual maintenance costs: $620 million. Operational infrastructure investment: $340 million in 2023.
- Fleet maintenance per vehicle: $2,800 annually
- Operational facility setup cost: $12-18 million per location
- Staff training and development: $45 million
Disclaimer
All information, articles, and product details provided on this website are for general informational and educational purposes only. We do not claim any ownership over, nor do we intend to infringe upon, any trademarks, copyrights, logos, brand names, or other intellectual property mentioned or depicted on this site. Such intellectual property remains the property of its respective owners, and any references here are made solely for identification or informational purposes, without implying any affiliation, endorsement, or partnership.
We make no representations or warranties, express or implied, regarding the accuracy, completeness, or suitability of any content or products presented. Nothing on this website should be construed as legal, tax, investment, financial, medical, or other professional advice. In addition, no part of this site—including articles or product references—constitutes a solicitation, recommendation, endorsement, advertisement, or offer to buy or sell any securities, franchises, or other financial instruments, particularly in jurisdictions where such activity would be unlawful.
All content is of a general nature and may not address the specific circumstances of any individual or entity. It is not a substitute for professional advice or services. Any actions you take based on the information provided here are strictly at your own risk. You accept full responsibility for any decisions or outcomes arising from your use of this website and agree to release us from any liability in connection with your use of, or reliance upon, the content or products found herein.