
|
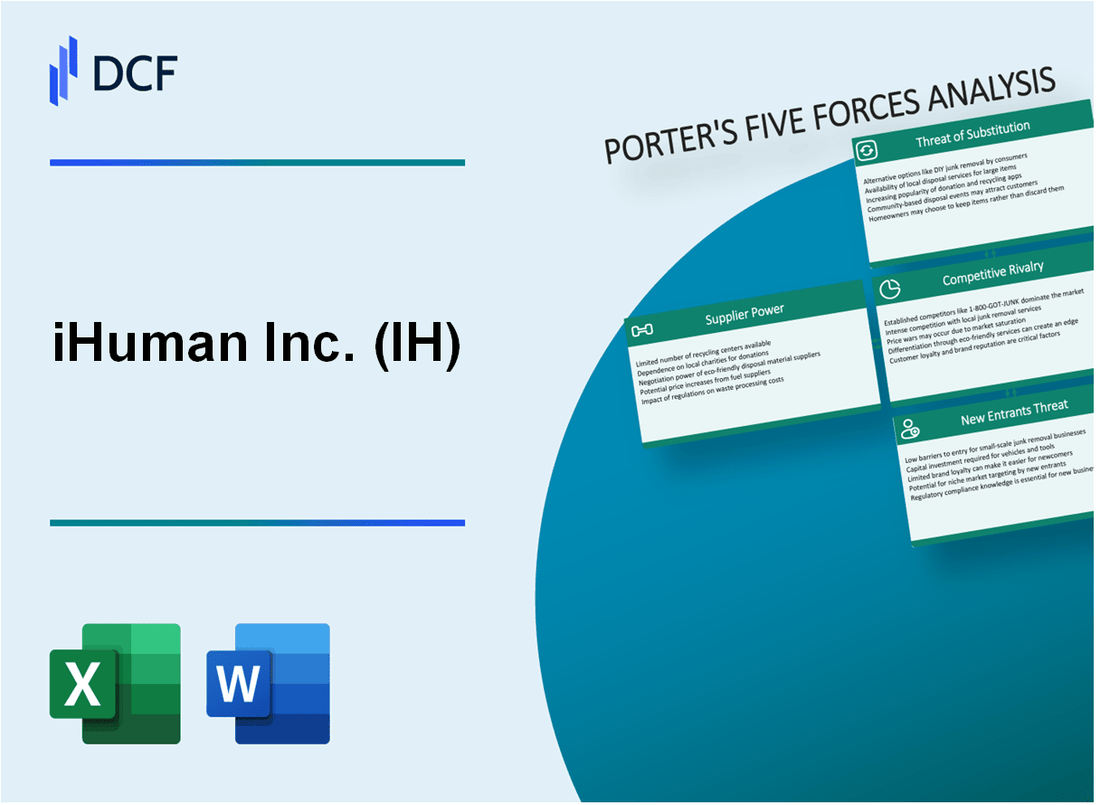
iHuman Inc. (IH): 5 FORCES Analysis [Nov-2025 Updated] |
Fully Editable: Tailor To Your Needs In Excel Or Sheets
Professional Design: Trusted, Industry-Standard Templates
Investor-Approved Valuation Models
MAC/PC Compatible, Fully Unlocked
No Expertise Is Needed; Easy To Follow
iHuman Inc. (IH) Bundle
The pressure from a shrinking domestic user base is defintely the central challenge for iHuman Inc. right now, and you need a clear map of the battlefield before making any calls. Looking at the Five Forces, we see a company managing intense competitive rivalry in a fragmented Chinese digital education space while revenue slipped 7.4% YoY to RMB200.2 million in Q2 2025. Still, they hold a strong 67.8% gross margin, suggesting content costs are currently managed, but high customer power due to low switching costs means that profitability is always under threat. Let's break down exactly where the leverage lies-from supplier power held by premium content partners to the looming threat of tech giants entering the fray-so you can see the near-term risks and opportunities clearly.
iHuman Inc. (IH) - Porter's Five Forces: Bargaining power of suppliers
You're analyzing iHuman Inc.'s competitive landscape, and the suppliers are a key area to watch, especially since the business is tech-powered. Honestly, supplier power here isn't monolithic; it splits between the creators of the core educational intellectual property (IP) and the providers of the underlying technology.
Content creators definitely hold a moderate level of power. iHuman Inc. needs proprietary, high-quality educational IP to keep its apps fresh and relevant, which means it can't just use generic material. This need for unique content gives established creators leverage in negotiations. To be fair, the company is actively working to mitigate this by expanding its own feature set, like the new photo recognition and speaking features in iHuman Chinese, which might reduce reliance on external content for core functionality.
Key technology suppliers-think the big names in AI model access and cloud infrastructure-hold significant leverage. iHuman Inc. is fundamentally a tech-powered product company, so a disruption or significant price hike from a core cloud or AI provider would hit the cost structure hard. We don't have the specific contract details, but this dependency is a structural reality in this industry.
Strategic partnerships, which bring premium content or distribution access, also increase supplier power in those specific lanes. For instance, iHuman Inc.'s move into the US market involves a strategic partnership with Cricket Media, where content from Reading Stars is being made more interactive with virtual quizzes starting in September 2025. While this opens a new market, it solidifies Cricket Media as a key partner whose terms matter significantly for that segment's success.
Here's the quick math on cost management, which tempers the immediate pressure from suppliers:
| Financial Metric (Q2 2025) | Value | Context |
| Gross Profit Margin | 67.8% | Suggests content and tech costs are currently manageable relative to revenue. |
| Gross Profit | US$19.0 million (RMB135.7 million) | The absolute profit generated before operating expenses. |
| R&D Expenses | US$7.4 million (RMB52.8 million) | A cost area related to technology development, down 7.7% YoY. |
| Cash, Equivalents, & Short-Term Investments (as of June 30, 2025) | US$153.6 million (RMB1,100.1 million) | Strong liquidity provides a buffer against aggressive supplier demands. |
The high gross margin of 67.8% in Q2 2025 is a strong indicator that, for now, iHuman Inc. is successfully managing its cost of revenues relative to its pricing power. What this estimate hides, though, is the rate of change; the margin actually compressed slightly from 70.5% in Q2 2024, which could signal rising input costs or strategic product mix shifts that suppliers are benefiting from.
You should keep an eye on a few things regarding these suppliers:
- Proprietary IP holders command moderate pricing power.
- Technology providers (AI/Cloud) have structural leverage.
- Partnerships like Cricket Media create specific supplier dependencies.
- The 67.8% gross margin shows costs are currently contained.
- Strong cash reserves of US$153.6 million reduce immediate vulnerability.
Finance: draft 13-week cash view by Friday.
iHuman Inc. (IH) - Porter's Five Forces: Bargaining power of customers
You're looking at a market where the end-user-the parent or guardian making the purchasing decision-holds significant sway, and that power is amplified by the nature of digital learning tools. Honestly, in the app economy, if a product doesn't immediately deliver perceived value, moving to a competitor is often just a few taps away.
Customer power is high due to low switching costs for app-based services. Once a subscription lapses or a user decides against renewal, migrating to an alternative educational app or platform requires minimal effort, time, or financial penalty. This ease of exit keeps iHuman Inc. under constant pressure to justify its pricing and demonstrate superior engagement.
Declining China birthrate and cautious consumer spending increase customer price sensitivity. This macro environment directly impacts discretionary spending on supplementary education. When the pool of potential new users shrinks due to demographic shifts, and existing customers feel economic uncertainty, they become much more focused on the price-to-value ratio of every RMB spent.
The financial results clearly reflect this customer reluctance. iHuman Inc.'s revenue dropped 6.9% year-over-year to RMB200.2 million in Q2 2025, compared to RMB215.1 million in the same period last year. This top-line pressure is a direct signal that customers are either spending less or churning at a higher rate. For context, Q1 2025 revenue was RMB210.4 million, showing a sequential decline leading into the second quarter.
Still, iHuman Inc. has some counter-leverage. A large user base provides a degree of stickiness through network effects, though this is less potent in a single-user educational app than in a social platform. The average total Monthly Active Users (MAUs) for Q2 2025 stood at 23.72 million. This is down from 24.57 million in Q2 2024, indicating that even the large base is shrinking under current market conditions. For comparison, the average total MAUs in Q1 2025 were 26.51 million.
Here's a quick look at the key user and revenue metrics showing the pressure:
| Metric | Q2 2025 Value | Q2 2024 Value | YoY Change |
| Revenue | RMB200.2 million | RMB215.1 million | -6.9% |
| Average Total MAUs | 23.72 million | 24.57 million | -3.5% |
| Net Income | RMB31.9 million | RMB24.7 million | +29.3% |
The fact that net income increased 29.3% year-over-year to RMB31.9 million despite the revenue decline highlights that iHuman Inc. is managing costs aggressively, which is a direct response to customer price sensitivity. Management reduced operating expenses by 12.5% to RMB116.3 million in Q2 2025.
The forces driving customer power can be summarized by these factors:
- Low switching costs for digital learning subscriptions.
- Revenue decline of 6.9% YoY in Q2 2025.
- MAUs decreased to 23.72 million in Q2 2025.
- Customer reluctance cited as a primary revenue headwind.
- Strong focus on cost reduction to maintain profitability.
Finance: draft 13-week cash view by Friday.
iHuman Inc. (IH) - Porter's Five Forces: Competitive rivalry
You're looking at iHuman Inc. (IH) in a market that's anything but sleepy. The competitive rivalry force here is definitely high, driven by a fragmented Chinese digital education market. Honestly, the barriers to entry haven't been high enough to keep the crowds out, which keeps the pressure on everyone.
iHuman Inc. is squaring off directly against established peers. You see this when you look at the larger-cap Chinese education ADRs, like New Oriental Education & Technology Group Inc. (EDU) and TAL Education Group (TAL). As of late 2025, EDU and TAL were trading on a forward P/E multiple averaging around 17.3x. To put iHuman Inc.'s position in perspective, if we conservatively annualize its first half of 2025 net income and assume zero growth in 2026, the implied forward P/E is only about 8.9x. That gap suggests the market prices in a higher risk or lower growth expectation, which is often a direct result of intense competition.
This rivalry translates directly into pricing pressure you can see in the margins. For the second quarter of 2025, iHuman Inc. reported revenues of RMB200.2 million and a net income of RMB31.9 million. Here's the quick math: that gives iHuman Inc. a net margin of approximately 15.93% for the quarter. What this estimate hides is that this margin is often under pressure compared to some international peers who might operate with different cost structures or market positioning.
To fight off this competition and maintain its edge, iHuman Inc. has to keep innovating. This forces substantial spending on staying ahead of the curve. For instance, in the second quarter of 2025, the company reported Research and development expenses totaling RMB52.8 million. That's a significant chunk of revenue dedicated just to keeping the product differentiated in a crowded space.
The competitive landscape involves several key players and market dynamics:
- Rivalry is intense in the fragmented Chinese digital education market with limited entry barriers.
- Competes directly with peers like QuantaSing Group and large-cap Chinese education ADRs (e.g., EDU, TAL).
- Pricing pressure is evident; the net margin is calculated at 15.93% for Q2 2025.
- Competition forces high R&D spending (RMB52.8 million in Q2 2025) to maintain product differentiation.
Here is a snapshot comparing iHuman Inc.'s Q2 2025 performance against the competitive context:
| Metric | iHuman Inc. (IH) Q2 2025 Value | Competitive Context/Peer Data |
|---|---|---|
| Revenue | RMB200.2 million | China EdTech market projected to exceed $100 billion by end of 2025 |
| Net Income | RMB31.9 million | Peer average forward P/E (EDU, TAL) is 17.3x |
| Net Margin | Approx. 15.93% (Calculated) | Implied IH forward P/E of 8.9x (conservative estimate) |
| R&D Expenses | RMB52.8 million | Top 7 China EdTech firms had a combined market value of US$30.7 billion in 2023 |
The pressure is real, and it shows up in the operational metrics. For example, iHuman Inc.'s average total Monthly Active Users (MAUs) dipped to 23.72 million in Q2 2025, down from 24.57 million a year prior. That user base contraction, despite strong net income growth driven by cost cuts, signals that retaining and growing users in this competitive environment is a constant battle.
Finance: draft a sensitivity analysis on the impact of a 5% drop in Q3 2025 net margin by next Tuesday.
iHuman Inc. (IH) - Porter's Five Forces: Threat of substitutes
You're analyzing the competitive landscape for iHuman Inc. (IH) and the substitutes for its tech-powered educational products are numerous and varied. Honestly, the sheer volume of alternatives means constant pressure on user attention and wallet share.
- Substitute threat is high from non-digital options like traditional books, toys, and tutoring services.
- Government screen-time regulations in China act as a strong, non-market-based substitute driver.
- General entertainment apps and mobile games are a constant substitute for educational screen time.
- The company mitigates this by expanding into offline products and integrated online-offline strategies.
The traditional tutoring segment, a direct substitute for supplemental education, shows significant scale. The global private tutoring market was valued at USD 124.5 Billion in 2024, with projections to reach USD 238.5 Billion by 2033. For context, the online tutoring segment was valued at USD 10.42 billion in 2024. iHuman Inc. reported average total Monthly Active Users (MAUs) of 26.51 million in Q1 2025, a number constantly competing against these non-digital and digital alternatives.
Here's a quick look at some market and company metrics that frame this threat:
| Metric Category | Data Point | Value/Amount | Period/Context |
| Market Size (Private Tutoring) | Global Valuation | USD 124.5 Billion | 2024 |
| Market Size (Online Tutoring) | Projected Valuation | USD 23.73 billion | By 2030 |
| iHuman Inc. (IH) Financials | Q1 2025 Revenue | RMB 210.4 million (US$29.0 million) | Q1 2025 |
| iHuman Inc. (IH) Operational | Average Total MAUs | 26.51 million | Q1 2025 |
| iHuman Inc. (IH) Strategy Cost | Gross Margin | 68.3% | Q1 2025 |
Regulatory action, or the threat of it, is a major non-market force. While previous rules limited gaming for minors to one hour per day on weekdays, a November 2025 report suggests a policy shift encouraging increased study and screen use in schools, including the removal of 'screen-free' times. This reversal could either reduce the substitute threat from non-educational screen time or increase the scrutiny on educational apps like iHuman Inc.'s offerings. What this estimate hides is the speed at which policy can pivot.
The company is actively pushing back against the digital-only substitute threat by diversifying its product mix. For example, the gross margin dipped to 68.3% in Q1 2025 from 71.5% in the prior year, mainly due to costs tied to its integrated online-offline strategy. This strategy includes launching the budget-friendly smart device, the iHuman All-Subject Master, and developing an AI-powered coding program for Boya School in Beijing, marking its first formal application in a school setting. Also, its international expansion, such as the partnership with Cricket Media whose Reading Stars magazine is available in 170 countries, diversifies away from purely domestic regulatory risk.
iHuman Inc. (IH) - Porter's Five Forces: Threat of new entrants
You're analyzing iHuman Inc.'s competitive landscape, and the threat of new entrants is definitely a key area to watch. Honestly, the barrier here is mixed. On one hand, getting a basic app off the ground is relatively cheap-the initial coding might not break the bank. But that's where the easy part ends, because content creation is where the real money goes, and that cost is substantial.
Consider the investment required just to keep pace. For the first quarter of 2025, iHuman Inc.'s Research and development expenses hit RMB55.4 million (US$7.6 million). Sales and marketing expenses for that same quarter were RMB41.3 million (US$5.7 million). These aren't one-time costs; they are recurring drains needed to innovate and acquire users in a crowded market. New entrants face this immediate, high-cost reality.
The financial muscle iHuman Inc. has built acts as a significant deterrent. As of March 31, 2025, the company held RMB1,119.1 million (US$154.2 million) in cash, cash equivalents, and short-term investments. That's a war chest that a startup simply doesn't have access to on day one. This liquidity is crucial for weathering market dips and funding the necessary R&D and marketing spend without immediate external pressure.
Here's a quick look at how those operating expenses stack up against that cash reserve from Q1 2025, showing the scale of the financial moat:
| Metric | Amount (RMB Million) | Date/Period |
| Cash, Cash Equivalents & Short-Term Investments | 1,119.1 | March 31, 2025 |
| Research and Development Expenses | 55.4 | Q1 2025 |
| Sales and Marketing Expenses | 41.3 | Q1 2025 |
| Total Operating Expenses (R&D + S&M) | 96.7 | Q1 2025 |
Still, the threat isn't zero, especially from established players. Brand recognition provides a soft barrier, but it's not impenetrable. For instance, iHuman Chinese is already recognized as an industry benchmark. Building that level of trust and market position takes years and significant investment in quality content, like when they grew the Chinese character library from 1,300 to 1,800 characters in Q1 2025 alone.
The biggest wild card is the entry potential of massive, well-capitalized tech giants. You know the names-Tencent and Alibaba. These companies operate with resources that dwarf iHuman Inc.'s balance sheet, and they could pivot into the educational app space with aggressive pricing or superior platform integration almost overnight. While they haven't made a major move yet, their capacity to absorb initial losses while building out content and marketing is a constant, high-level risk.
The barriers to entry can be summarized by looking at the required investment versus current operational efficiency:
- App development entry cost is low, but content creation is high.
- Brand recognition (iHuman Chinese is an industry benchmark) creates a significant soft barrier.
- Large tech giants (Tencent, Alibaba) could easily enter the educational app space with massive resources.
- The need for a large cash reserve (RMB1,119.1 million in cash as of March 31, 2025) for marketing and R&D acts as a financial barrier.
For you, the immediate action is to monitor any strategic shifts from those large tech players, as that would instantly move this force from moderate to high. Finance: confirm the latest cash balance as of September 30, 2025, by the end of next week.
Disclaimer
All information, articles, and product details provided on this website are for general informational and educational purposes only. We do not claim any ownership over, nor do we intend to infringe upon, any trademarks, copyrights, logos, brand names, or other intellectual property mentioned or depicted on this site. Such intellectual property remains the property of its respective owners, and any references here are made solely for identification or informational purposes, without implying any affiliation, endorsement, or partnership.
We make no representations or warranties, express or implied, regarding the accuracy, completeness, or suitability of any content or products presented. Nothing on this website should be construed as legal, tax, investment, financial, medical, or other professional advice. In addition, no part of this site—including articles or product references—constitutes a solicitation, recommendation, endorsement, advertisement, or offer to buy or sell any securities, franchises, or other financial instruments, particularly in jurisdictions where such activity would be unlawful.
All content is of a general nature and may not address the specific circumstances of any individual or entity. It is not a substitute for professional advice or services. Any actions you take based on the information provided here are strictly at your own risk. You accept full responsibility for any decisions or outcomes arising from your use of this website and agree to release us from any liability in connection with your use of, or reliance upon, the content or products found herein.