
|
Zevia PBC (ZVIA): BCG Matrix [Dec-2025 Updated] |
Fully Editable: Tailor To Your Needs In Excel Or Sheets
Professional Design: Trusted, Industry-Standard Templates
Investor-Approved Valuation Models
MAC/PC Compatible, Fully Unlocked
No Expertise Is Needed; Easy To Follow
Zevia PBC (ZVIA) Bundle
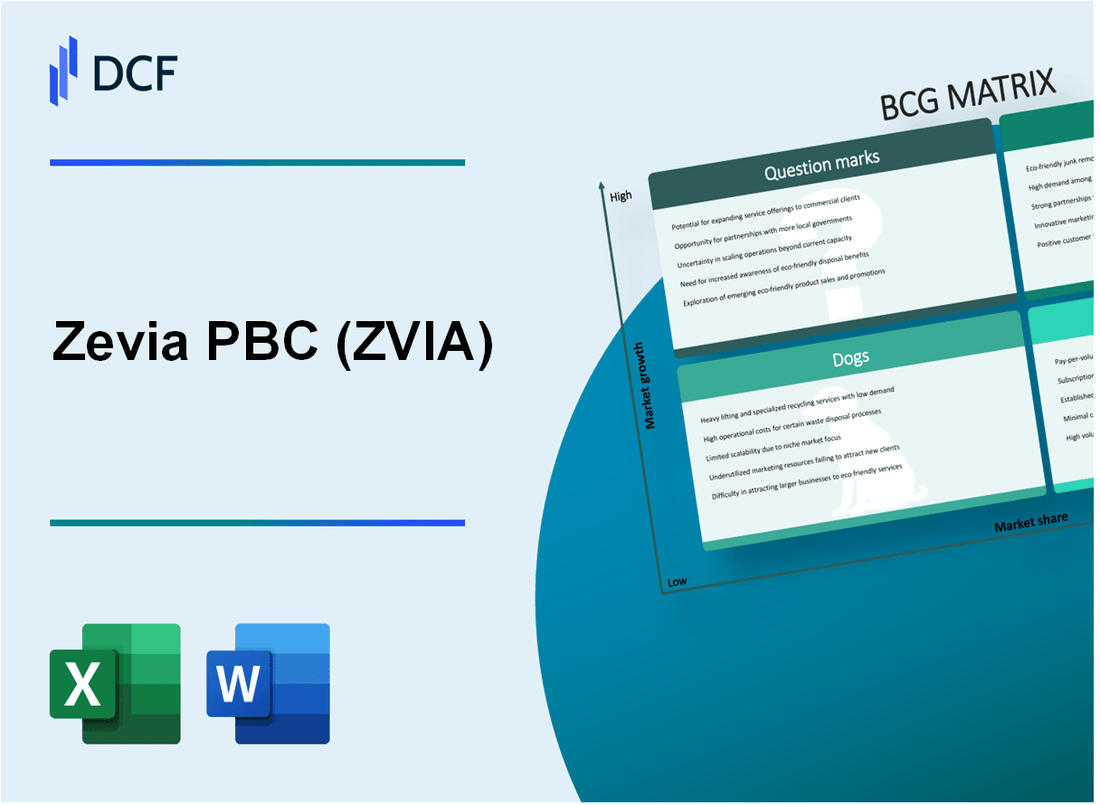
You need a clear-eyed view of Zevia PBC's portfolio right now, and the BCG Matrix shows exactly where the capital is flowing. Honestly, the story is one of high-potential growth fighting current losses: the Zero-Sugar Soda is a clear Star, fueling 12.3% Q3 volume growth, yet the company is still guiding toward a $5 million to $5.5 million Adjusted EBITDA loss for the year. We'll map out how they've aggressively cut the Dogs-like the Kidz Drinks-and analyze if the Energy Drinks can graduate from 'Question Mark' to 'Star' status before the next funding round. Dive in to see the strategic allocation.
Background of Zevia PBC (ZVIA)
You're looking at Zevia PBC (ZVIA), the company that's been shaking up the beverage aisle with its naturally delicious, zero-calorie, zero-sugar, clean-label drinks. Honestly, they've carved out a niche in the non-alcoholic beverage industry by focusing on health-conscious consumers. Their product platform is pretty broad, covering everything from Soda and Energy Drinks to Organic Tea, Mixers, Kidz drinks, and Sparkling Water.
The way they get these products to you is through a network of retailers across the U.S. and Canada, hitting food, drug, mass, natural, and e-commerce channels. Now, looking at the most recent numbers from their third quarter ending September 30, 2025, the top line showed some real momentum. Net sales grew 12.3% year-over-year to $40.8 million, which beat what analysts were expecting.
This growth is definitely being fueled by strategic wins, like expanded distribution at major players such as Walmart and in the Club channel. Plus, they've been pushing new flavors, which seems to be resonating with consumers. However, the profitability picture is still a work in progress. For Q3 2025, Zevia PBC reported a net loss of $2.8 million, which was the same as the prior year's third quarter, and an Adjusted EBITDA loss of $1.7 million.
We also need to watch the gross margin, which settled at 45.6% in Q3 2025, a dip of 3.5 percentage points from the year before. Management pointed to higher inventory losses tied to a packaging refresh and the full impact of tariffs as the main reasons for that margin pressure. Still, the operational focus is clearly paying off in other areas; selling expenses as a percentage of sales actually decreased.
Because of that strong Q3 performance, Zevia PBC actually raised its full-year 2025 net sales guidance to a range of $162 million to $164 million. Even better, they tightened up their expected full-year Adjusted EBITDA loss to between $5 million to $5.5 million, which is a significant improvement over prior guidance. On the balance sheet as of September 30, 2025, they held $26.0 million in cash and equivalents, importantly carrying no outstanding debt. The whole team is definitely driving hard toward their stated goal of achieving profitability in 2026.
Zevia PBC (ZVIA) - BCG Matrix: Stars
You're analyzing Zevia PBC (ZVIA) and the Zero-Sugar Soda category clearly fits the Star quadrant: high market share in a rapidly expanding market, demanding heavy investment to maintain leadership. Honestly, this is where the growth story is right now.
Zero-Sugar Soda: Core Product Driving Growth
The core Zero-Sugar Soda line is the engine for recent top-line performance. For the third quarter ended September 30, 2025, Zevia PBC reported Net Sales grew 12.3% year-over-year, reaching $40.8 million. This growth was underpinned by volume expansion, specifically, sales volumes rose 12.6% compared to the prior year period. This indicates that the product itself is resonating strongly with consumers looking for cleaner labels.
Here's a quick look at the recent marketing investment supporting this core driver:
| Metric | Q3 2024 Value | Q3 2025 Value |
| Net Sales (USD Millions) | Not explicitly stated, but implied growth from $40.8M in Q3 2025 | $40.8 million |
| Marketing Expenses (USD Millions) | $3.5 million | $4.9 million |
| Marketing Expense (% of Net Sales) | 9.7% | 12.1% |
Expanded Distribution
To capture that high market growth, Zevia PBC is heavily focused on placement. The company has made significant strides in its retail footprint. For instance, distribution at Walmart expanded from 800 stores to over 4,300 stores nationwide. This channel strength is validated by product performance; the new variety pack is now the best-selling Zevia SKU within the Walmart assortment. Furthermore, proprietary data suggests strong household adoption, with consumers purchasing 4x more Zevia products per household versus competitors.
The success in key channels is translating into strong consumer metrics:
- New variety pack is the #1 Zevia SKU at Walmart.
- Proprietary research noted double-digit gains in brand consideration and purchase intent.
- Distribution expanded 5x at Walmart nationwide.
Primary Marketing Focus
Stars require significant cash infusion to maintain their high market share in a growing segment, and you see that reflected in the marketing budget. The brand-building investment is substantial. In Q3 2025, marketing expenses totaled $4.9 million, representing 12.1% of net sales. This is a deliberate increase from the $3.5 million, or 9.7% of net sales, spent in Q3 2024. The management team explicitly stated this increase was driven by investments made to drive brand awareness. This spend is necessary to fight for shelf space and consumer mindshare against larger incumbents.
High-Growth Segment
The market Zevia PBC operates in provides the tailwind for this Star classification. The broader Zero Sugar Beverages Market is projected to grow at a Compound Annual Growth Rate (CAGR) of 14.7% between 2025 to 2035. This high growth rate justifies the heavy investment in marketing and distribution. The market size was estimated at USD 4,345.6 million in 2025, with a projected value of USD 17,127.2 million by 2035. This environment means that if Zevia PBC can sustain its relative share, it is on a clear path to becoming a Cash Cow as the market matures.
Zevia PBC (ZVIA) - BCG Matrix: Cash Cows
You're looking at the established parts of Zevia PBC's portfolio-the lines that, in theory, should be funding the rest of the operation. These are the brands with a solid foothold in the market that don't require massive new spending to maintain their position. However, for Zevia PBC, the reality is that the entire company is still in a growth and investment phase, meaning no product line currently fits the classic, highly profitable Cash Cow mold.
None: Zevia PBC is not a profitable company, guiding to an Adjusted EBITDA loss of $5 million to $5.5 million for the full year 2025. This overall loss position means that, financially speaking, the company isn't generating the excess cash flow Cash Cows are known for. The focus remains on driving volume and efficiency to reach the targeted positive Adjusted EBITDA in 2026.
Organic Tea: This product line is positioned as a stable, mature offering. While we don't have the segment-specific gross margin, the overall company gross profit margin for the third quarter of 2025 was reported at 45.6%. This margin, achieved despite headwinds like inventory losses tied to the packaging refresh and tariffs, shows the underlying product contribution is positive, supporting the idea of a stable, mature line that generates a positive gross margin without requiring heavy new investment.
Sparkling Water: This represents an established category presence for Zevia PBC. While the overall market for sparkling water is mature, Zevia PBC's growth is currently driven by volume increases, with Q3 2025 volumes up 12.6%, largely due to expanded distribution at Walmart and Club channels. This established presence helps provide shelf-space leverage and steady, albeit small, revenue contributions across the portfolio.
Low Investment: These lines are maintained to capture existing consumer demand, freeing up capital for the high-growth 'Stars' and 'Question Marks.' The company's focus on operational excellence and cost-savings initiatives, which realized $15 million in annual savings to date, supports this strategy. The goal is to 'milk' the gains passively by keeping support spending low relative to revenue, even as the company works to improve its overall financial standing.
Here's the quick math on the current financial reality versus the Cash Cow ideal. The unit economics are definitely improving, which is the key to future cash generation:
| Metric | Q3 2025 Actual | Full Year 2025 Guidance |
| Net Sales | $40.8 million | $162 million to $164 million |
| Gross Profit Margin | 45.6% | N/A |
| Adjusted EBITDA | Loss of $1.7 million | Loss of $5.0 million to $5.5 million |
| Contribution Margin | 26.7% | N/A |
| Cash & Equivalents (End Q3) | $26.0 million | N/A |
The improvement in unit economics, seen by the contribution margin rising from 5.7% in Q3 2023 to 26.7% in Q3 2025, is the strongest indicator that these established lines are becoming more efficient to support. Still, the company's overall negative Adjusted EBITDA means the 'Cash Cow' label is aspirational for now.
- These lines capture existing consumer demand.
- They free up capital for high-growth segments.
- Unit economics show significant improvement year-over-year.
- Productivity initiative realized $15 million in savings to date.
- The company is targeting positive Adjusted EBITDA by 2026.
Finance: draft 13-week cash view by Friday.
Zevia PBC (ZVIA) - BCG Matrix: Dogs
You're looking at the product lines Zevia PBC actively removed from its portfolio to sharpen focus, which fit squarely into the Dogs quadrant as of late 2024/early 2025.
Kidz Drinks SKUs were explicitly discontinued as part of a streamlining effort in the first half of 2025. This move was designed to improve overall profitability by shedding low-performing assets. The financial commitment to this strategic shift was partially reflected in the $2.1 million in restructuring expenses reported in the first quarter of 2025, which primarily included employee-related severance costs.
The Mixer SKUs represented another product line exit executed in H1 2025. This represented a clear move away from a category where Zevia PBC held a low market share and generated low returns. This action followed the strategic decision made in 2024 to exit both the Kids and Mixers categories to concentrate resources on the core soda business.
Here's a quick look at the financial context surrounding these strategic exits:
| Metric | 2023 Full Year | 2024 Full Year | 2025 Q1 |
| Net Sales (in thousands) | $166,400 | $155,000 | $38,000 |
| Net Sales Change YoY | N/A | -6.8% | -2.0% |
| Restructuring Expenses (in thousands) | N/A | N/A | $2,100 |
The Lost Distribution events in 2024 set the stage for these 2025 cuts. Products experienced losses in the club channels and one customer in the mass channel throughout 2024. This distribution loss was a major factor in the full-year 2024 net sales decline of $11.4 million, or 6.8%, year-over-year. Management signaled they were not fighting to regain this specific distribution, confirming the Dog status of those affected lines. The full-year 2024 revenue was $155.0 million.
Regarding Low Relative Share, these exited products were characterized by minimal market share, making them a drag on the overall gross margin before they were cut. The company's focus shifted to core soda SKUs, which, along with productivity initiatives, helped drive the gross profit margin up to 50.1% in Q1 2025, compared to 45.7% in Q1 2024. The overall strategy is clearly one of divestiture and simplification to improve profitability, targeting profitability in 2026.
The elements categorized as Dogs included:
- Kidz Drinks SKUs, explicitly discontinued in H1 2025.
- Mixer SKUs, exited in H1 2025 to focus on soda.
- Products losing club and one mass channel distribution in 2024.
- Lines with minimal market share that pressured gross margin.
Finance: review the Q3 2025 gross margin of 45.6% against the Q1 2025 margin of 50.1% to assess the impact of inventory losses and tariffs on the remaining portfolio by end of week.
Zevia PBC (ZVIA) - BCG Matrix: Question Marks
The Question Marks quadrant in the Boston Consulting Group Matrix represents Zevia PBC (ZVIA) business units operating in high-growth markets but currently holding a low relative market share. These units demand significant cash investment to fuel growth but have not yet generated substantial returns, thus consuming company resources.
Energy Drinks: Operates in the high-growth energy category, but management notes the current focus is 'really on soda' for now.
For Zevia PBC (ZVIA), the energy drink category fits the Question Mark profile perfectly, given management's explicit prioritization of the core soda business. CEO Amy Taylor confirmed in Q3 2025 commentary that the current operational focus is 'really on soda', even while acknowledging the energy segment's potential. This indicates that relative market share in energy drinks remains low as resources are channeled elsewhere. The company's overall net sales for Q3 2025 reached $40.8 million, with the full-year 2025 net sales guidance raised to a range of $162 million to $164 million, demonstrating where the current revenue strength lies.
Future Opportunity: CEO sees 'tremendous opportunity ahead in energy,' suggesting a high-growth potential but low current market share.
The CEO's outlook for energy drinks suggests management views the category as a future Star, justifying the current investment phase. The broader liquid refreshment beverages market, where Zevia PBC (ZVIA) competes, is valued at approximately $270 billion, indicating the high-growth environment for any successful entrant. The potential for the energy segment is clear, but realizing it requires a shift in investment focus away from the established soda base. The company is working to grow brand awareness, which management noted still has a way to go, despite reporting double-digit increases in purchase intent and consideration in Q3 2025.
Innovation Pipeline: New flavor launches like Strawberry Lemon Burst are high-risk, high-reward bets requiring upfront investment.
The company is actively fueling its growth and attempting to convert potential Question Marks into Stars through product development. Recent launches, including Strawberry Lemon Burst and Orange Creamsicle, are part of this high-risk, high-reward strategy to drive consumer trial and excitement. This innovation is a key component of the required investment. As of the August 2025 conference, marketing spend had increased from 6% to 12% of revenue year-to-date, reflecting the cash burn necessary to support new product introductions and build brand presence across all categories.
Capital Intensive: Requires significant future marketing and distribution investment to convert low relative share into a 'Star' product.
The Question Mark status is financially characterized by cash consumption, as evidenced by the ongoing net losses despite revenue growth. Converting the energy drink segment, or any nascent product line, requires sustained, heavy spending on marketing and distribution expansion. The financial reality of this investment phase is captured in the following figures from the third quarter of 2025 and the updated full-year outlook:
| Metric | Value (Q3 2025) | Value (Full Year 2025 Guidance Midpoint) |
|---|---|---|
| Net Sales | $40.8 million | $163 million |
| Selling & Marketing Expenses | $12.7 million | N/A |
| Marketing Expense (% of Sales) | 12.1% (or $4.9 million) | N/A |
| Net Loss | $2.8 million | N/A |
| Adjusted EBITDA Loss | $1.7 million | $5.25 million |
| Cash & Equivalents (End of Q3) | Approx. $26 million | N/A |
This cash usage is necessary to drive the distribution gains that support the entire portfolio. The company is actively building its foundation, which includes expanding distribution at major partners like Walmart and in the club channel. The path forward for these Question Marks is clear:
- Invest Heavily: Allocate capital to marketing and distribution to rapidly gain share in high-growth areas like energy drinks.
- Divest: Sell off units that fail to show a quick path to increased market share and profitability.
- Monitor Burn Rate: The current cash position of approximately $26 million, supplemented by an undrawn $20 million revolving credit line, must cover the projected full-year Adjusted EBITDA loss of $5 million to $5.5 million.
The success of the core soda business, which generated 12.3% year-over-year revenue growth in Q3 2025, is what funds the necessary, high-risk bets on categories like energy drinks. Finance: draft 13-week cash view by Friday.
Disclaimer
All information, articles, and product details provided on this website are for general informational and educational purposes only. We do not claim any ownership over, nor do we intend to infringe upon, any trademarks, copyrights, logos, brand names, or other intellectual property mentioned or depicted on this site. Such intellectual property remains the property of its respective owners, and any references here are made solely for identification or informational purposes, without implying any affiliation, endorsement, or partnership.
We make no representations or warranties, express or implied, regarding the accuracy, completeness, or suitability of any content or products presented. Nothing on this website should be construed as legal, tax, investment, financial, medical, or other professional advice. In addition, no part of this site—including articles or product references—constitutes a solicitation, recommendation, endorsement, advertisement, or offer to buy or sell any securities, franchises, or other financial instruments, particularly in jurisdictions where such activity would be unlawful.
All content is of a general nature and may not address the specific circumstances of any individual or entity. It is not a substitute for professional advice or services. Any actions you take based on the information provided here are strictly at your own risk. You accept full responsibility for any decisions or outcomes arising from your use of this website and agree to release us from any liability in connection with your use of, or reliance upon, the content or products found herein.