
|
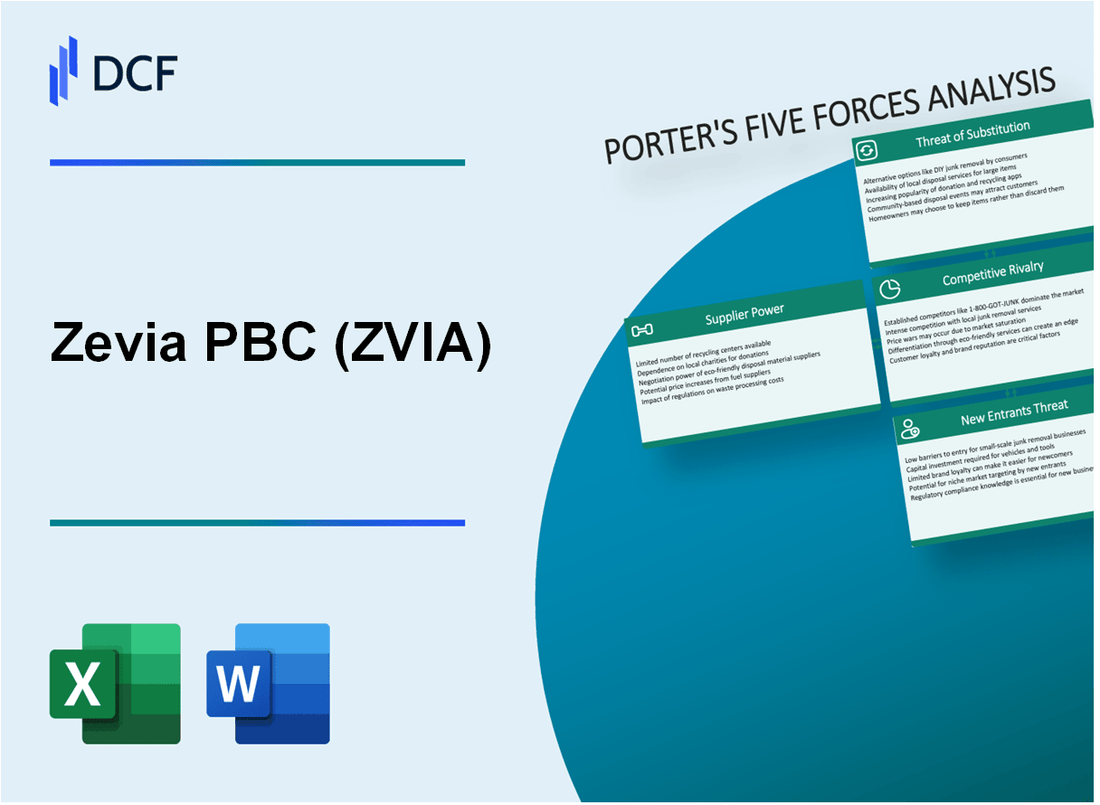
Zevia PBC (ZVIA): 5 FORCES Analysis [Nov-2025 Updated] |
Fully Editable: Tailor To Your Needs In Excel Or Sheets
Professional Design: Trusted, Industry-Standard Templates
Investor-Approved Valuation Models
MAC/PC Compatible, Fully Unlocked
No Expertise Is Needed; Easy To Follow
Zevia PBC (ZVIA) Bundle
You're looking at a company like Zevia PBC, trying to carve out a space in the massive beverage aisle, and honestly, the competitive landscape is brutal. As we head into late 2025, the pressure is clear: management is guiding for revenue between $162 million and $164 million, yet they are still projecting an Adjusted EBITDA loss of $5 million to $5.5 million for the year. That gap tells you everything you need to know about the five forces at play-from the leverage held by major retailers and giants like Coca-Cola to the constant threat of cheap substitutes like flavored sparkling water. Below, I break down exactly how supplier costs, customer power, rivalry intensity, and entry barriers are shaping Zevia PBC's path forward, so you can see where the real risk and potential upside lie.
Zevia PBC (ZVIA) - Porter's Five Forces: Bargaining power of suppliers
You're assessing Zevia PBC's supplier dynamics as of late 2025, and the picture is one of rising external pressure, even as internal agreements offer some insulation. Overall, the bargaining power of suppliers for Zevia PBC sits in a moderate range, but specific commodity and manufacturing dependencies are creating clear cost headwinds you need to watch.
The most immediate evidence of supplier power comes through input costs. The full realization of higher aluminum tariffs has been a significant factor impacting profitability. This is not a guess; we saw the direct financial consequence in the third quarter of 2025. The gross margin compressed to 45.6% in Q3 2025, a notable drop of 350 basis points from the 49.1% reported in Q3 2024. Management explicitly noted that aluminum tariffs are an ongoing headwind that they expect to continue navigating. This suggests that the suppliers in the packaging/material space, particularly those tied to aluminum, hold leverage through external market forces like trade policy.
Here's a quick look at the margin compression that highlights the supplier cost impact:
| Metric | Q3 2024 Value | Q3 2025 Value | Change (bps/Amount) |
|---|---|---|---|
| Gross Profit Margin | 49.1% | 45.6% | -350 basis points |
| Inventory Obsolescence (Packaging Refresh) | N/A | $0.8 million | One-time impact |
| Tariff Impact | Partially realized | Full realization | Ongoing headwind |
The gross margin was further impacted by a one-time event, the packaging refresh, which resulted in $0.8 million in inventory obsolescence recognized in Q3 2025. To be fair, management indicated that the bulk of this inventory write-off impact was largely captured in that quarter, which should ease pressure going into Q4 2025 and beyond, but the tariff pressure remains. Still, the company's ability to pass these costs on to buyers is constrained by the competitive beverage market.
On the flip side, Zevia PBC has structured its raw material purchasing to limit direct supplier leverage through contractual minimums. As of mid-2024, the company stated it does not have any material agreements with suppliers for the purchase of raw material with minimum purchase quantities. Furthermore, the forecasts provided to their contract manufacturers are short-term, extending at no time beyond a year. This flexibility means Zevia PBC isn't locked into large, unfavorable volume commitments, which definitely helps temper the power of those specific raw material providers.
However, concentration risk is definitely present due to the nature of beverage production. Zevia PBC relies on a network of co-packers and, critically, aluminum can suppliers. The sensitivity to aluminum tariffs underscores the leverage held by the can suppliers. You should be tracking any changes in the number or terms of their primary co-packing partners, as losing one or facing unfavorable renegotiation terms could significantly disrupt the supply chain and drive up the Cost of Goods Sold again.
- Reliance on co-packers creates operational concentration risk.
- Aluminum tariff impact highlights supplier power in packaging.
- No material minimum purchase agreements limit contractual lock-in.
- Forecasts to manufacturers extend for no more than a year.
Finance: draft 13-week cash view by Friday.
Zevia PBC (ZVIA) - Porter's Five Forces: Bargaining power of customers
You're looking at Zevia PBC's relationship with its buyers, and honestly, the power dynamic leans heavily toward the big retailers. The beverage aisle is crowded, and when a customer can easily grab a Coke Zero or a La Croix instead, switching costs for the end consumer are practically zero. This ease of substitution gives the shelf space owners-the major retailers-a huge upper hand in negotiations.
The evidence of this leverage is clear in Zevia PBC's recent history. The company experienced a significant setback in 2024 directly attributable to these powerful buyers. Specifically, Zevia PBC lost distribution in the club channel and one major customer in the mass channel during that year. This customer concentration risk materialized as a -6.8% decrease in net sales for the full year 2024. That loss of just two types of outlets had a material impact on the top line.
Retailer power also manifests through pricing demands. We see this pressure on Zevia PBC's average selling price (ASP) because of increased promotional activity demanded by these large buyers. For instance, increased promotional activity at retailers was a factor in the net sales decline of 2.0% Zevia PBC saw in the first quarter of 2025. While Zevia PBC has managed to improve its gross profit margin to 50.1% in Q1 2025, this improvement was partially offset by higher promotional activity. It's a constant tug-of-war: Zevia PBC needs the shelf space, and retailers demand better margins or lower prices to feature the product.
The reliance on key accounts is a near-term risk. While Zevia PBC is aggressively pursuing growth through expanded distribution, such as increasing its Walmart presence to 4,300 stores from a previous 800, the company still operates with a relatively small footprint compared to giants, distributing to just over 37,000 retail locations at the end of 2024. This dependence means that any future negotiation leverage held by a major retailer remains a primary threat to Zevia PBC's pricing strategy and profitability.
Here is a quick look at the key metrics illustrating this buyer power:
| Metric | Value | Period/Context |
| Full Year 2024 Revenue Decline Attributed to Lost Distribution | -6.8% | Due to loss of club and one mass customer. |
| Q1 2025 Net Sales Decline Attributed to Promotions | -2.0% (partial cause) | Increased promotional activity at retailers. |
| Walmart Store Count Expansion | From 800 to 4,300 | Key growth driver in 2025. |
| Total Retail Locations | Over 37,000 | As of the end of 2024. |
| Q1 2025 Household Penetration | 5.0% | Down from 5.4% previously. |
The flip side is that Zevia PBC is showing some success in deepening relationships with the customers it does have. For example, in Q1 2025, dollar sales per household actually rose to $37.60, and purchase frequency ticked up to 3.6 trips annually. Still, the power to grant or revoke shelf space is what really matters here.
Zevia PBC (ZVIA) - Porter's Five Forces: Competitive rivalry
The competitive rivalry facing Zevia PBC is exceptionally high, stemming from the sheer dominance of established beverage titans and the rapid ascent of focused, better-for-you rivals. You're competing in a market where the incumbents have near-limitless resources for marketing and distribution, so Zevia's fight for shelf space and consumer mindshare is a constant battle.
Rivalry is intense against giants like Coca-Cola (KO) and PepsiCo (PEP). To put the scale difference into perspective, consider the revenue disparity. Zevia PBC reported third quarter 2025 net sales of just \$40.8 million. Contrast that with Coca-Cola's first quarter 2025 revenue, which stood at \$11.1 billion. This massive gap illustrates the structural power the giants wield in negotiations, procurement, and consumer advertising spend.
Zevia has a significant cost disadvantage due to smaller scale and lower operating leverage. While Zevia's Q3 2025 Gross Profit Margin was 45.6%, the sheer volume and established supply chains of the major players mean their per-unit costs are almost certainly lower, even if their reported margins differ due to product mix or accounting. The company is still unprofitable, guiding an Adjusted EBITDA loss of \$5 million to \$5.5 million for fiscal 2025, whereas competitors like The Vita Coco Company project an Adjusted EBITDA between \$86 million and \$92 million for 2025.
Competition also includes fast-growing, better-for-you brands like Celsius (CELH) and Vita Coco (COCO). These companies are capturing the same health-conscious consumer Zevia targets, often with significant momentum. Celsius Holdings, for example, reported trailing twelve-month revenue ending September 30, 2025, of \$2.13 billion, dwarfing Zevia's year-to-date sales of \$123.39 million as of September 30, 2025.
Here's a quick look at the revenue scale among key players as of late 2025:
| Company | Latest Reported Revenue Metric | Amount |
|---|---|---|
| Coca-Cola (KO) | Q1 2025 Revenue | \$11.1 billion |
| Celsius Holdings (CELH) | TTM Revenue (ending Sep 30, 2025) | \$2.13 billion |
| The Vita Coco Company (COCO) | Q3 2025 Net Sales | \$182 million |
| Zevia PBC (ZVIA) | Q3 2025 Net Sales | \$40.8 million |
The pressure from these rivals forces Zevia PBC to invest heavily to maintain relevance. The company's Q3 2025 Selling and Marketing Expenses were \$12.7 million, representing 31.0% of net sales. This level of spending is necessary just to keep pace.
The competitive landscape demands specific focus areas for Zevia:
- Rivalry intensity is high in the zero-sugar segment.
- Giants like KO have massive distribution leverage.
- CELH shows rapid growth in the functional beverage space.
- Zevia's Q3 2025 Gross Margin was 45.6%.
- The company projects an Adjusted EBITDA loss for 2025 of \$5.0M to \$5.5M.
If onboarding takes 14+ days, churn risk rises.
Zevia PBC (ZVIA) - Porter's Five Forces: Threat of substitutes
You're looking at Zevia PBC (ZVIA) and wondering how easily customers can just grab something else off the shelf instead. That's the core of the threat of substitutes, and honestly, for Zevia PBC, it's a major pressure point.
Threat is high from tap water, flavored sparkling water, and unsweetened teas. Consider the cost difference: tap water costs only a few cents per gallon, resulting in significantly lower annual expenses, potentially just a few dollars for a year's supply. Even bottled sparkling water, which is a direct competitor in the fizzy space, saw one consumer spend $929.53 in 2024. For context on the scale of these substitutes, the broader Low- and No-calorie Soda Market is estimated to be worth $22.3 billion in 2025, dwarfing Zevia PBC's own projected 2025 net sales guidance of $162 million to $164 million.
Major competitors offer their own zero-sugar alternatives, directly substituting Zevia PBC's niche. We see this play out with the giants. PepsiCo's recarbonated Pepsi Zero Sugar, using a sucralose/acesulfame potassium blend, achieved 16% in sales in 2023. Over in Europe, Coca-Cola's 'Coca-Cola Stevia No Sugar' accounted for 10% of Coke zero-sugar volume. In contrast, Zevia PBC recorded 22% sales growth driven by its clean-label, stevia-sweetened offerings. The sheer scale of these competitors shows the substitution risk: Coca-Cola generates $47.5B more revenue than Zevia PBC, and Keurig Dr Pepper (KDP) generates $16B more.
Consumers can defintely switch easily due to the low-cost nature of many substitutes. The ease of switching is amplified by the massive distribution and marketing power of these established players. For example, Monster Energy recently added a Passionfruit Punch to its Zero-Sugar Ultra line. The cost of entry for consumers to try a major brand's zero-sugar offering is often lower than for a niche player like Zevia PBC, especially when considering promotional pricing at mass retailers.
The broader 'better-for-you' beverage market is still under $1 billion, making it vulnerable to mainstream products. While the global Better-For-You (BFY) beverages market was valued at $197.3 million in 2023 and is projected to reach $484.0 million by 2034, this niche size relative to the overall beverage industry shows its vulnerability. The larger Zero Sugar Beverages Market is expected to hit $4,345.6 million in 2025. This smaller BFY segment, where Zevia PBC operates, is easily overshadowed and susceptible to product migrations from consumers trading up or down within the larger zero-sugar category.
Here's a quick look at the competitive landscape scale:
| Market/Entity | Relevant 2025 Figure (USD) | Context |
| Low- and No-calorie Soda Market Size | $22.3 billion | Total market size, showing the scale of substitutes |
| Global Sparkling Water Market Value | $47.8 billion | Direct substitute category size |
| Zevia PBC Full Year Net Sales Guidance | $162 million to $164 million | Zevia PBC's expected revenue for comparison |
| PepsiCo Zero Sugar Sales Contribution (2023) | 16% | Success metric for a major competitor's zero-sugar alternative |
| Tap Water Annual Cost Estimate | A few dollars | The lowest-cost substitute |
The threat of substitution is not just about price; it's about the ease of finding a comparable, heavily marketed alternative that meets the same zero-sugar need. Zevia PBC's success depends on convincing consumers that its specific clean-label sweetener profile is worth the premium over these massive, readily available substitutes.
Zevia PBC (ZVIA) - Porter's Five Forces: Threat of new entrants
You're looking at how hard it is for a new zero-sugar soda company to break into Zevia PBC's market, and honestly, the hurdles are significant. The established players have spent decades building the infrastructure, making it a huge capital sink for anyone starting out.
The first major hurdle is getting your product onto the shelves where people shop. The beverage industry is a slow process; as long as you slowly accumulate experience, it becomes a huge barrier to entry. Think about the scale Zevia PBC itself has had to build. For instance, Zevia PBC expanded its presence in Walmart from 800 stores to 4,300 stores to achieve national distribution, illustrating the sheer number of placements a new entrant must secure across all retailers.
New entrants also face high capital requirements for brand building and marketing just to get noticed above the noise. Zevia PBC's own investment in this area shows the necessary spend. In the third quarter of 2025, Zevia PBC's marketing expense alone was $4.9 million, representing 12.1% of its net sales for that period. This level of spending is needed just to maintain and grow an existing niche brand.
Here's a quick look at the selling and marketing spend for Zevia PBC in Q3 2025 to give you a sense of the scale of investment required in this space:
| Metric | Amount (Q3 2025) | Percentage of Net Sales (Q3 2025) |
| Marketing Expense | $4.9 million | 12.1% |
| Selling Expense | $7.7 million | 18.9% |
| Total Selling & Marketing Expenses | $12.7 million | 31.0% |
Also, established brand loyalty for incumbent beverage companies remains a strong deterrent. Consumers often default to known brands, making the trial cost (in terms of consumer time and money) high for a newcomer. Still, even for a relatively established niche player like Zevia PBC, capturing new consumers is tough.
Zevia PBC's own household penetration in the first quarter of 2025 was only 5.0%. That low figure, despite Zevia PBC's efforts, shows the difficulty in moving the needle on consumer adoption in this crowded category. To be fair, Zevia PBC's Q3 2025 net sales were $40.8 million, showing they are growing, but that 5.0% penetration suggests the overall market is still dominated by incumbents.
Finance: draft 13-week cash view by Friday.
Disclaimer
All information, articles, and product details provided on this website are for general informational and educational purposes only. We do not claim any ownership over, nor do we intend to infringe upon, any trademarks, copyrights, logos, brand names, or other intellectual property mentioned or depicted on this site. Such intellectual property remains the property of its respective owners, and any references here are made solely for identification or informational purposes, without implying any affiliation, endorsement, or partnership.
We make no representations or warranties, express or implied, regarding the accuracy, completeness, or suitability of any content or products presented. Nothing on this website should be construed as legal, tax, investment, financial, medical, or other professional advice. In addition, no part of this site—including articles or product references—constitutes a solicitation, recommendation, endorsement, advertisement, or offer to buy or sell any securities, franchises, or other financial instruments, particularly in jurisdictions where such activity would be unlawful.
All content is of a general nature and may not address the specific circumstances of any individual or entity. It is not a substitute for professional advice or services. Any actions you take based on the information provided here are strictly at your own risk. You accept full responsibility for any decisions or outcomes arising from your use of this website and agree to release us from any liability in connection with your use of, or reliance upon, the content or products found herein.