
|
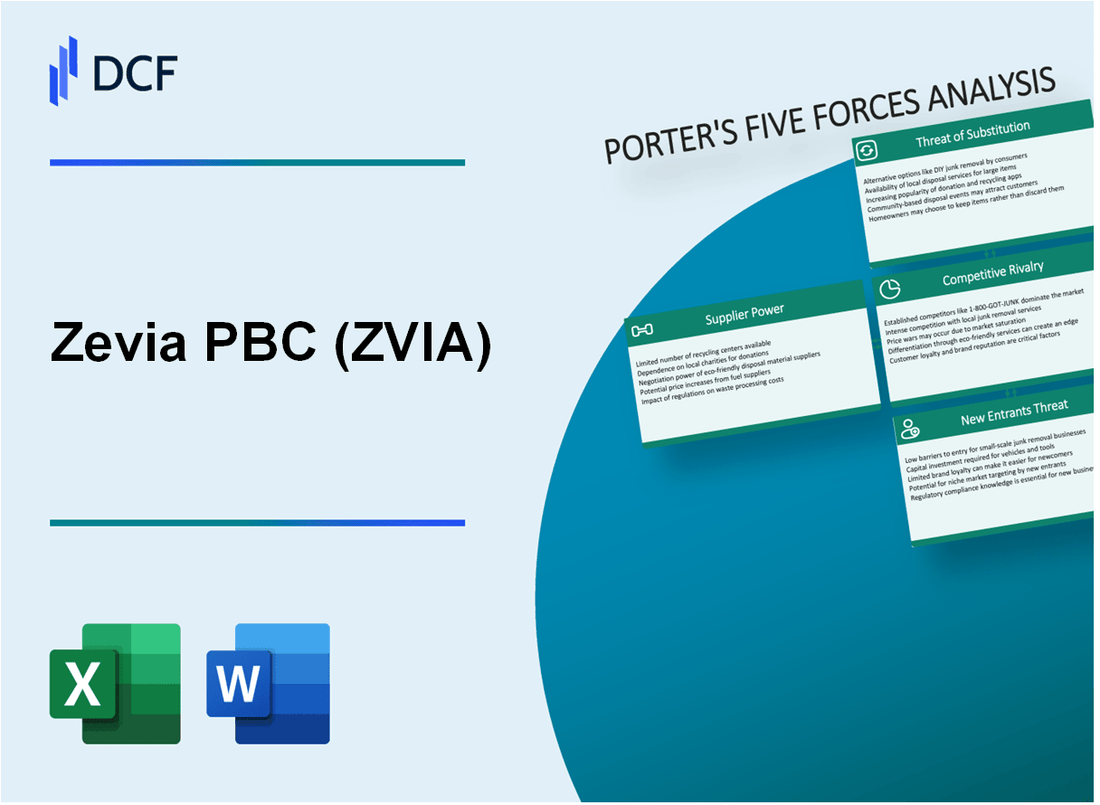
Zevia PBC (ZVIA): 5 forças Análise [Jan-2025 Atualizada] |
Totalmente Editável: Adapte-Se Às Suas Necessidades No Excel Ou Planilhas
Design Profissional: Modelos Confiáveis E Padrão Da Indústria
Pré-Construídos Para Uso Rápido E Eficiente
Compatível com MAC/PC, totalmente desbloqueado
Não É Necessária Experiência; Fácil De Seguir
Zevia PBC (ZVIA) Bundle
No mundo dinâmico de bebidas zero-calorias, a Zevia PBC está em um momento crítico, navegando em um cenário complexo de forças de mercado que moldam seu posicionamento estratégico. À medida que os consumidores preocupados com a saúde exigem cada vez mais alternativas naturais e de baixo açúcar, a empresa enfrenta um desafio multifacetado de equilibrar relacionamentos com fornecedores, expectativas dos clientes, pressões competitivas, substitutos em potencial e barreiras à entrada. Este mergulho profundo na estrutura das Five Forces de Michael Porter revela a intrincada dinâmica que determinará a vantagem competitiva de Zei e o sucesso futuro no mercado de bebidas funcionais cada vez mais lotado.
ZEVIA PBC (ZVIA) - As cinco forças de Porter: poder de barganha dos fornecedores
Número limitado de adoçantes naturais e fornecedores de estévia
A partir de 2024, o mercado global de estévia está avaliado em US $ 648,1 milhões, com apenas 5 principais fornecedores de estévia controlando aproximadamente 62% da participação de mercado. Os principais fornecedores incluem:
| Fornecedor | Quota de mercado | Capacidade de produção anual |
|---|---|---|
| Ingredion Incorporated | 23% | 45.000 toneladas métricas |
| GLG Life Tech Corporation | 15% | 30.000 toneladas métricas |
| PureCircle Limited | 14% | 28.000 toneladas métricas |
Restrições da cadeia de suprimentos para ingredientes especializados de zero-calorias
A cadeia de suprimentos de ingredientes zero-calóricos exibe restrições significativas:
- 3-4 fabricantes especializados globalmente
- Praxo médio de entrega: 6-8 semanas para produção de ingredientes personalizados
- Os custos de produção variam de US $ 12 a US $ 18 por quilograma
Dependência de fornecedores de ingredientes orgânicos e naturais
O fornecimento de ingredientes orgânicos da Zeivia revela dependências críticas:
| Categoria de ingredientes | Número de fornecedores certificados | Volatilidade dos preços |
|---|---|---|
| Estévia orgânica | 7 fornecedores globais | 15-22% de flutuação anual de preços |
| Sabores naturais | 9 fornecedores certificados | 10-18% Variação anual de preço |
Mercado de fornecedores concentrados para insumos de produção de bebidas
Métricas de concentração de mercado de entrada de produção de bebidas:
- Taxa de concentração do fornecedor: 68%
- Os 4 principais fornecedores controlam US $ 2,3 bilhões em mercado
- Custos médios de troca de fornecedores: US $ 75.000 a US $ 120.000
ZEVIA PBC (ZVIA) - As cinco forças de Porter: poder de barganha dos clientes
Consumidores conscientes da saúde que buscam alternativas de baixo açúcar
De acordo com o relatório de bebidas 2023 da Mintel, 72% dos consumidores buscam ativamente opções de bebidas com baixo teor de açúcar. O posicionamento zero-açúcar da Zevia tem como alvo esse segmento de mercado em crescimento.
| Segmento do consumidor | Porcentagem interessada em bebidas com baixo teor de açúcar |
|---|---|
| Millennials | 68% |
| Gen Z | 76% |
| Gen X. | 62% |
Sensibilidade ao preço no mercado competitivo de bebidas
O preço médio de varejo para a Zevia é de US $ 7,99 por pacote de seis, em comparação com US $ 5,49 para marcas de refrigerante tradicionais.
- Consumidores dispostos a pagar o prêmio por opções mais saudáveis: 54%
- Elasticidade do preço no mercado de bebidas: 1.3
- Gastos médios do consumidor em bebidas alternativas: US $ 12,50 por semana
A demanda crescente por opções naturais de bebidas com zero caloria
O mercado de bebidas naturais projetado para atingir US $ 423,7 bilhões até 2027, com um CAGR de 8,5%.
| Ano | Tamanho do mercado de bebidas naturais |
|---|---|
| 2023 | US $ 285,6 bilhões |
| 2027 (projetado) | US $ 423,7 bilhões |
Aumentar a preferência do consumidor pela transparência no fornecimento de ingredientes
A Nielsen relata que 73% dos consumidores estão dispostos a pagar mais por produtos com listas de ingredientes transparentes.
- Crescimento da tendência da etiqueta limpa: 12,4% anualmente
- Consumidores Verificando rótulos de ingredientes: 68%
- Disposição de mudar de marca para melhor ingrediente transparência: 57%
ZEVIA PBC (ZVIA) - As cinco forças de Porter: rivalidade competitiva
Cenário competitivo Overview
A partir de 2024, o mercado de bebidas zero-calorias e de bebidas naturais demonstra intensidade competitiva significativa, com a Zevia enfrentando a concorrência direta de vários segmentos.
| Concorrente | Quota de mercado | Receita anual |
|---|---|---|
| Coca-Cola Zero Açúcar | 12.3% | US $ 8,2 bilhões |
| PepsiCo Zero | 10.7% | US $ 7,5 bilhões |
| Zevia | 1.2% | US $ 93,4 milhões (2023) |
Análise de fragmentação do mercado
O segmento de bebidas naturais mostra crescente complexidade com várias marcas emergentes.
- Número de marcas de bebidas artesanais: 487
- Startups de bebidas focadas na saúde: 213
- Marcas de bebidas com zero-calorias totais: 612
Métricas de inovação de produtos
| Categoria de inovação | Investimento anual | Novos lançamentos de produtos |
|---|---|---|
| Despesas de P&D | US $ 4,2 milhões | 7 novos produtos |
| Variações de sabor | US $ 1,5 milhão | 12 novos sabores |
Indicadores de pressão competitivos
Zevia experimenta pressão significativa no mercado com a seguinte dinâmica competitiva:
- Taxa de concentração de mercado: 65%
- Preço médio do produto: US $ 2,49 por unidade
- Índice de Intensidade Competitiva: 0,78
ZEVIA PBC (ZVIA) - As cinco forças de Porter: ameaça de substitutos
Mercado em crescimento de água, chá e bebidas de baixa caloria
O mercado global de bebidas de baixa caloria foi avaliado em US $ 15,8 bilhões em 2022, com um CAGR projetado de 6,2% de 2023 a 2030. Zevia compete nesse segmento com várias opções alternativas de bebidas.
| Categoria de bebida | Tamanho do mercado 2022 | Taxa de crescimento |
|---|---|---|
| Bebidas de baixa caloria | US $ 15,8 bilhões | 6,2% CAGR |
| Água com gás | US $ 29,3 bilhões | 12,6% CAGR |
| Bebidas funcionais | US $ 187,5 bilhões | 7,8% CAGR |
Surgimento de bebidas funcionais e alternativas focadas no bem-estar
As estatísticas funcionais do mercado de bebidas demonstram pressão competitiva significativa:
- O mercado global de bebidas funcionais atingiu US $ 187,5 bilhões em 2022
- Projetado para crescer para US $ 267,9 bilhões até 2027
- Alternativas focadas no bem-estar capturam 35% do segmento de consumidor consciente da saúde
Ascensão das tendências de cervejas domésticas e de bebidas diy
Indicadores de mercado de criação de casas:
- Mercado de equipamentos de criação de casas avaliadas em US $ 2,1 bilhões em 2022
- Espera -se atingir US $ 3,5 bilhões até 2028
- 32% dos millennials preferem a preparação de bebidas diy
Crescente popularidade da água com gás e kombucha
| Bebida | 2022 Tamanho do mercado | Crescimento anual |
|---|---|---|
| Água com gás | US $ 29,3 bilhões | 12.6% |
| Kombucha | US $ 2,4 bilhões | 15.3% |
Principais métricas de substituição competitiva para a Zevia:
- Preço médio por unidade: US $ 1,75 - US $ 2,50
- Sensibilidade ao preço do consumidor: 68% dispostos a mudar para redução de 15% de custo
- Lealdade à marca no mercado de bebidas: 22% permanecem consistentes com a marca preferida
ZEVIA PBC (ZVIA) - As cinco forças de Porter: ameaça de novos participantes
Requisitos de capital inicial para produção de bebidas
A Zevia enfrenta uma barreira baixa à entrada, com custos estimados de inicialização que variam de US $ 50.000 a US $ 250.000 para produção de bebidas em pequena escala. As opções de fabricação de contratos reduzem os investimentos iniciais de capital em aproximadamente 40-60%.
| Categoria de custo | Faixa estimada |
|---|---|
| Equipamento | $75,000 - $150,000 |
| Inventário de ingrediente inicial | $25,000 - $50,000 |
| Embalagem | $30,000 - $75,000 |
Interesse do consumidor em marcas de bebidas focadas na saúde
O mercado de bebidas de saúde demonstra um potencial de crescimento significativo:
- O mercado global de bebidas funcionais projetado para atingir US $ 208,13 bilhões até 2028
- Taxa de crescimento anual composta (CAGR) de 8,5% de 2021 a 2028
- Segmento de bebidas zero-açúcar crescendo 9,2% ao ano
Processo de desenvolvimento de produtos
Complexidade de desenvolvimento de produtos:
- Tempo médio de mercado: 6-9 meses
- Complexidade de fornecimento de ingredientes: baixo a moderado
- Cronograma de aprovação regulatória: 3-4 meses
Barreiras de entrada de marketing digital
| Canal de marketing | Custo médio de aquisição de clientes |
|---|---|
| Publicidade nas mídias sociais | US $ 3,56 por clique |
| Marketing de influenciadores | US $ 10 - US $ 100 por post |
| Google anúncios | $ 1,16 por clique |
Zevia PBC (ZVIA) - Porter's Five Forces: Competitive rivalry
The competitive rivalry facing Zevia PBC is exceptionally high, stemming from the sheer dominance of established beverage titans and the rapid ascent of focused, better-for-you rivals. You're competing in a market where the incumbents have near-limitless resources for marketing and distribution, so Zevia's fight for shelf space and consumer mindshare is a constant battle.
Rivalry is intense against giants like Coca-Cola (KO) and PepsiCo (PEP). To put the scale difference into perspective, consider the revenue disparity. Zevia PBC reported third quarter 2025 net sales of just \$40.8 million. Contrast that with Coca-Cola's first quarter 2025 revenue, which stood at \$11.1 billion. This massive gap illustrates the structural power the giants wield in negotiations, procurement, and consumer advertising spend.
Zevia has a significant cost disadvantage due to smaller scale and lower operating leverage. While Zevia's Q3 2025 Gross Profit Margin was 45.6%, the sheer volume and established supply chains of the major players mean their per-unit costs are almost certainly lower, even if their reported margins differ due to product mix or accounting. The company is still unprofitable, guiding an Adjusted EBITDA loss of \$5 million to \$5.5 million for fiscal 2025, whereas competitors like The Vita Coco Company project an Adjusted EBITDA between \$86 million and \$92 million for 2025.
Competition also includes fast-growing, better-for-you brands like Celsius (CELH) and Vita Coco (COCO). These companies are capturing the same health-conscious consumer Zevia targets, often with significant momentum. Celsius Holdings, for example, reported trailing twelve-month revenue ending September 30, 2025, of \$2.13 billion, dwarfing Zevia's year-to-date sales of \$123.39 million as of September 30, 2025.
Here's a quick look at the revenue scale among key players as of late 2025:
| Company | Latest Reported Revenue Metric | Amount |
|---|---|---|
| Coca-Cola (KO) | Q1 2025 Revenue | \$11.1 billion |
| Celsius Holdings (CELH) | TTM Revenue (ending Sep 30, 2025) | \$2.13 billion |
| The Vita Coco Company (COCO) | Q3 2025 Net Sales | \$182 million |
| Zevia PBC (ZVIA) | Q3 2025 Net Sales | \$40.8 million |
The pressure from these rivals forces Zevia PBC to invest heavily to maintain relevance. The company's Q3 2025 Selling and Marketing Expenses were \$12.7 million, representing 31.0% of net sales. This level of spending is necessary just to keep pace.
The competitive landscape demands specific focus areas for Zevia:
- Rivalry intensity is high in the zero-sugar segment.
- Giants like KO have massive distribution leverage.
- CELH shows rapid growth in the functional beverage space.
- Zevia's Q3 2025 Gross Margin was 45.6%.
- The company projects an Adjusted EBITDA loss for 2025 of \$5.0M to \$5.5M.
If onboarding takes 14+ days, churn risk rises.
Zevia PBC (ZVIA) - Porter's Five Forces: Threat of substitutes
You're looking at Zevia PBC (ZVIA) and wondering how easily customers can just grab something else off the shelf instead. That's the core of the threat of substitutes, and honestly, for Zevia PBC, it's a major pressure point.
Threat is high from tap water, flavored sparkling water, and unsweetened teas. Consider the cost difference: tap water costs only a few cents per gallon, resulting in significantly lower annual expenses, potentially just a few dollars for a year's supply. Even bottled sparkling water, which is a direct competitor in the fizzy space, saw one consumer spend $929.53 in 2024. For context on the scale of these substitutes, the broader Low- and No-calorie Soda Market is estimated to be worth $22.3 billion in 2025, dwarfing Zevia PBC's own projected 2025 net sales guidance of $162 million to $164 million.
Major competitors offer their own zero-sugar alternatives, directly substituting Zevia PBC's niche. We see this play out with the giants. PepsiCo's recarbonated Pepsi Zero Sugar, using a sucralose/acesulfame potassium blend, achieved 16% in sales in 2023. Over in Europe, Coca-Cola's 'Coca-Cola Stevia No Sugar' accounted for 10% of Coke zero-sugar volume. In contrast, Zevia PBC recorded 22% sales growth driven by its clean-label, stevia-sweetened offerings. The sheer scale of these competitors shows the substitution risk: Coca-Cola generates $47.5B more revenue than Zevia PBC, and Keurig Dr Pepper (KDP) generates $16B more.
Consumers can defintely switch easily due to the low-cost nature of many substitutes. The ease of switching is amplified by the massive distribution and marketing power of these established players. For example, Monster Energy recently added a Passionfruit Punch to its Zero-Sugar Ultra line. The cost of entry for consumers to try a major brand's zero-sugar offering is often lower than for a niche player like Zevia PBC, especially when considering promotional pricing at mass retailers.
The broader 'better-for-you' beverage market is still under $1 billion, making it vulnerable to mainstream products. While the global Better-For-You (BFY) beverages market was valued at $197.3 million in 2023 and is projected to reach $484.0 million by 2034, this niche size relative to the overall beverage industry shows its vulnerability. The larger Zero Sugar Beverages Market is expected to hit $4,345.6 million in 2025. This smaller BFY segment, where Zevia PBC operates, is easily overshadowed and susceptible to product migrations from consumers trading up or down within the larger zero-sugar category.
Here's a quick look at the competitive landscape scale:
| Market/Entity | Relevant 2025 Figure (USD) | Context |
| Low- and No-calorie Soda Market Size | $22.3 billion | Total market size, showing the scale of substitutes |
| Global Sparkling Water Market Value | $47.8 billion | Direct substitute category size |
| Zevia PBC Full Year Net Sales Guidance | $162 million to $164 million | Zevia PBC's expected revenue for comparison |
| PepsiCo Zero Sugar Sales Contribution (2023) | 16% | Success metric for a major competitor's zero-sugar alternative |
| Tap Water Annual Cost Estimate | A few dollars | The lowest-cost substitute |
The threat of substitution is not just about price; it's about the ease of finding a comparable, heavily marketed alternative that meets the same zero-sugar need. Zevia PBC's success depends on convincing consumers that its specific clean-label sweetener profile is worth the premium over these massive, readily available substitutes.
Zevia PBC (ZVIA) - Porter's Five Forces: Threat of new entrants
You're looking at how hard it is for a new zero-sugar soda company to break into Zevia PBC's market, and honestly, the hurdles are significant. The established players have spent decades building the infrastructure, making it a huge capital sink for anyone starting out.
The first major hurdle is getting your product onto the shelves where people shop. The beverage industry is a slow process; as long as you slowly accumulate experience, it becomes a huge barrier to entry. Think about the scale Zevia PBC itself has had to build. For instance, Zevia PBC expanded its presence in Walmart from 800 stores to 4,300 stores to achieve national distribution, illustrating the sheer number of placements a new entrant must secure across all retailers.
New entrants also face high capital requirements for brand building and marketing just to get noticed above the noise. Zevia PBC's own investment in this area shows the necessary spend. In the third quarter of 2025, Zevia PBC's marketing expense alone was $4.9 million, representing 12.1% of its net sales for that period. This level of spending is needed just to maintain and grow an existing niche brand.
Here's a quick look at the selling and marketing spend for Zevia PBC in Q3 2025 to give you a sense of the scale of investment required in this space:
| Metric | Amount (Q3 2025) | Percentage of Net Sales (Q3 2025) |
| Marketing Expense | $4.9 million | 12.1% |
| Selling Expense | $7.7 million | 18.9% |
| Total Selling & Marketing Expenses | $12.7 million | 31.0% |
Also, established brand loyalty for incumbent beverage companies remains a strong deterrent. Consumers often default to known brands, making the trial cost (in terms of consumer time and money) high for a newcomer. Still, even for a relatively established niche player like Zevia PBC, capturing new consumers is tough.
Zevia PBC's own household penetration in the first quarter of 2025 was only 5.0%. That low figure, despite Zevia PBC's efforts, shows the difficulty in moving the needle on consumer adoption in this crowded category. To be fair, Zevia PBC's Q3 2025 net sales were $40.8 million, showing they are growing, but that 5.0% penetration suggests the overall market is still dominated by incumbents.
Finance: draft 13-week cash view by Friday.
Disclaimer
All information, articles, and product details provided on this website are for general informational and educational purposes only. We do not claim any ownership over, nor do we intend to infringe upon, any trademarks, copyrights, logos, brand names, or other intellectual property mentioned or depicted on this site. Such intellectual property remains the property of its respective owners, and any references here are made solely for identification or informational purposes, without implying any affiliation, endorsement, or partnership.
We make no representations or warranties, express or implied, regarding the accuracy, completeness, or suitability of any content or products presented. Nothing on this website should be construed as legal, tax, investment, financial, medical, or other professional advice. In addition, no part of this site—including articles or product references—constitutes a solicitation, recommendation, endorsement, advertisement, or offer to buy or sell any securities, franchises, or other financial instruments, particularly in jurisdictions where such activity would be unlawful.
All content is of a general nature and may not address the specific circumstances of any individual or entity. It is not a substitute for professional advice or services. Any actions you take based on the information provided here are strictly at your own risk. You accept full responsibility for any decisions or outcomes arising from your use of this website and agree to release us from any liability in connection with your use of, or reliance upon, the content or products found herein.