
|
A Allstate Corporation (All): Análise SWOT [Jan-2025 Atualizada] |
Totalmente Editável: Adapte-Se Às Suas Necessidades No Excel Ou Planilhas
Design Profissional: Modelos Confiáveis E Padrão Da Indústria
Pré-Construídos Para Uso Rápido E Eficiente
Compatível com MAC/PC, totalmente desbloqueado
Não É Necessária Experiência; Fácil De Seguir
The Allstate Corporation (ALL) Bundle
No cenário dinâmico do seguro, a Allstate Corporation permanece como um participante formidável, navegando desafios complexos de mercado com precisão estratégica. Esta análise SWOT abrangente revela a intrincada dinâmica do modelo de negócios da Allstate, explorando como um Mais de 100 anos A gigante de seguros se adapta à interrupção tecnológica, em evolução das necessidades do consumidor e ambientes de risco cada vez mais imprevisíveis. Ao dissecar os pontos fortes, fracos, oportunidades e ameaças de Allstate, fornecemos um roteiro perspicaz ao posicionamento competitivo da empresa e possíveis trajetórias estratégicas no ecossistema de seguros que transformou rapidamente.
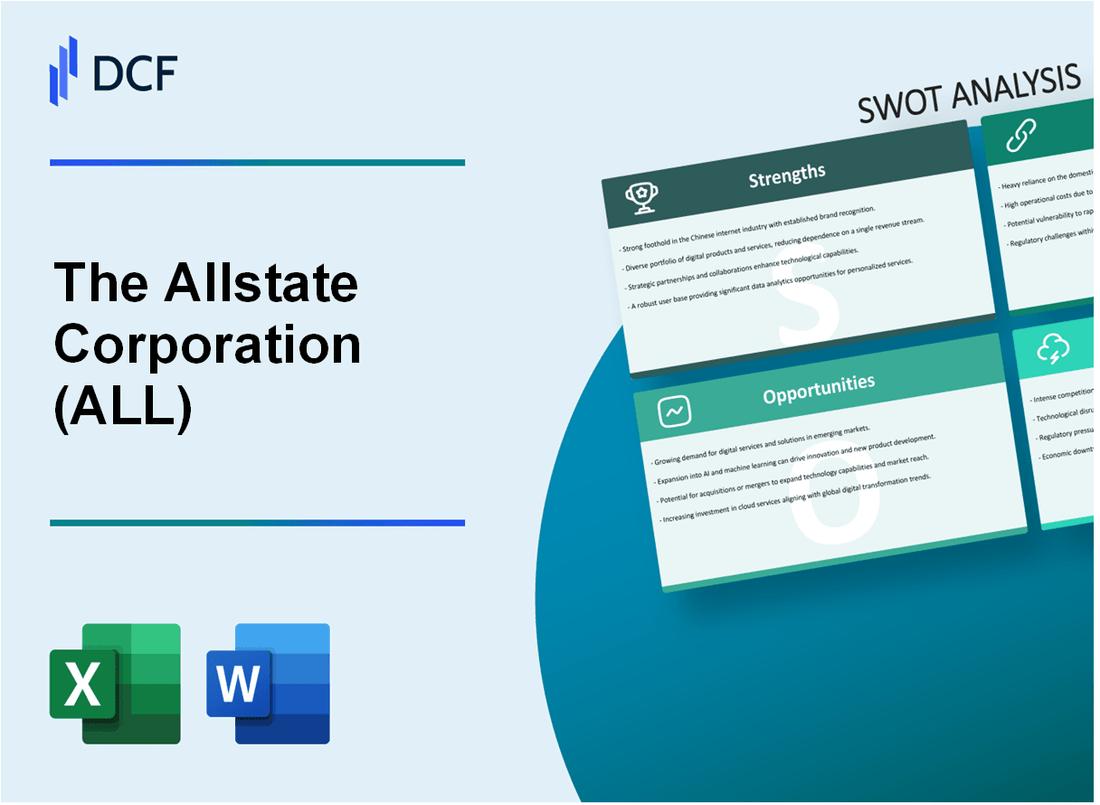
A Allstate Corporation (All) - Análise SWOT: Pontos fortes
Liderança de mercado em propriedade pessoal e seguro de vítimas
Allstate segura a 17,3% de participação de mercado no mercado de seguros de propriedade e vítimas pessoais dos EUA a partir de 2023. A empresa gera US $ 56,7 bilhões em prêmios anuais em seus segmentos de seguro.
| Posição de mercado | Métricas -chave |
|---|---|
| Participação de mercado dos EUA | 17.3% |
| Prêmios anuais | US $ 56,7 bilhões |
| Número de agentes | 44,000+ |
Desempenho financeiro
Allstate demonstra fortes métricas financeiras com US $ 58,4 bilhões em receita total para 2023. A empresa mantém pagamentos consistentes de dividendos e programas de recompra de ações.
- 2023 Lucro líquido: US $ 2,1 bilhões
- Rendimento de dividendos: 2,8%
- Programa de recompra de ações: US $ 2,5 bilhões autorizados em 2023
Portfólio de produtos de seguro diversificado
A Allstate oferece cobertura abrangente de seguro em vários segmentos:
| Produto de seguro | Posição de mercado |
|---|---|
| Seguro automóvel | #2 no mercado dos EUA |
| Seguro dos proprietários | #3 no mercado dos EUA |
| Seguro de vida | Presença nacional significativa |
| Seguro comercial | Segmento de mercado em crescimento |
Infraestrutura de tecnologia digital
Allstate investiu US $ 425 milhões em infraestrutura tecnológica em 2023. Suporte de plataformas digitais 75% das interações do cliente.
- Usuários de aplicativos móveis: 22 milhões
- Processamento de reivindicações on -line: 68% do total de reivindicações
- Sistemas de atendimento ao cliente orientados pela IA
Rede de distribuição
A Allstate mantém uma robusta estratégia de distribuição multicanal:
| Canal de vendas | Porcentagem de vendas |
|---|---|
| Agentes exclusivos | 45% |
| Agentes independentes | 22% |
| Vendas on -line diretas | 28% |
| Plataforma móvel | 5% |
A Allstate Corporation (All) - Análise SWOT: Fraquezas
Alta dependência do mercado pessoal de seguro automóvel
O segmento de seguro automóvel pessoal da Allstate representou 54,3% do total de prêmios por escrito em 2022, com US $ 44,3 bilhões em prêmios diretos. A vulnerabilidade da empresa é evidente na mudança do cenário de transporte.
| Segmento de mercado | Volume premium | Quota de mercado |
|---|---|---|
| Seguro automóvel pessoal | US $ 44,3 bilhões | 16.2% |
| Seguro de propriedade | US $ 22,7 bilhões | 8.5% |
Desafios de inovação digital
Os investimentos em transformação digital da Allstate totalizaram US $ 387 milhões em 2022, o que é menor em comparação com os gastos dos concorrentes da InsurTech.
- Investimento de plataforma digital: US $ 387 milhões
- Tecnologia orçamento de P&D: US $ 212 milhões
- Eficiência de transformação digital: 68% em comparação com os líderes da indústria
Exposição catastrófica de eventos
As perdas naturais de desastres para a Allstate em 2022 atingiram US $ 3,6 bilhões, representando um risco significativo nos segmentos de seguro de propriedade.
| Tipo de desastre | Impacto financeiro | Volume de reivindicações |
|---|---|---|
| Furacões | US $ 1,9 bilhão | 42.500 reivindicações |
| Incêndios florestais | US $ 890 milhões | 18.300 reivindicações |
Custos de conformidade regulatória
As despesas de conformidade para a Allstate em 2022 totalizaram US $ 426 milhões, representando 3,7% do total de despesas operacionais.
Pressões de margem
Allstate experimentou a proporção combinada de 102,4% Em 2022, indicando desafios para manter a lucratividade.
| Métrica financeira | 2022 Valor | Mudança de ano a ano |
|---|---|---|
| Proporção combinada | 102.4% | +4.6% |
| Margem de lucro líquido | 4.2% | -1.3% |
A Allstate Corporation (All) - Análise SWOT: Oportunidades
Expandindo para produtos de seguros baseados em uso e telemática que aproveitam a tecnologia
O mercado de seguros de telemática se projetou para atingir US $ 67,5 bilhões até 2026, com um CAGR de 19,8%. O Programa Drivewise da Allstate já registrou mais de 3 milhões de clientes, representando um potencial de crescimento de 12% no segmento de seguro baseado em uso.
| Segmento de mercado da Telematics | Valor projetado | Taxa de crescimento anual |
|---|---|---|
| Seguro de telemática global | US $ 67,5 bilhões | 19.8% |
| Allstate matrícula de direção | 3 milhões de clientes | 12% |
Mercado em crescimento para seguros cibernéticos e serviços de proteção de risco digital
O mercado de seguros cibernéticos deve atingir US $ 29,2 bilhões até 2027, com um CAGR de 21,2%. A oportunidade de receita potencial da Allstate estimada em US $ 500 milhões neste setor emergente.
- Tamanho global do mercado de seguros cibernéticos: US $ 29,2 bilhões até 2027
- Potencial estimado de receita de seguro cibernético Allstate: US $ 500 milhões
- Taxa de crescimento anual projetada: 21,2%
Aquisições em potencial ou parcerias estratégicas em setores emergentes de tecnologia de seguros
Os investimentos em tecnologia de seguros (InsurTech) atingiram US $ 7,1 bilhões em 2022, apresentando oportunidades significativas de parceria para a Allstate.
| Categoria de investimento InsurTech | Investimento total | Ano |
|---|---|---|
| Investimentos globais de insurtech | US $ 7,1 bilhões | 2022 |
Aumento da demanda por soluções de seguro personalizadas usando análise de dados
O mercado de seguros personalizado que deve crescer para US $ 26,5 bilhões até 2025, com a análise de dados impulsionando abordagens centradas no cliente.
- Tamanho do mercado de seguros personalizados: US $ 26,5 bilhões até 2025
- Taxa de crescimento de soluções de seguro orientada a dados: 15,3%
Expansão de seguros comerciais e ofertas de seguros para pequenas empresas
O mercado de seguros para pequenas empresas se projetou para atingir US $ 42,3 bilhões até 2026, com um CAGR de 8,5%. O atual segmento de seguro comercial da Allstate representa uma oportunidade de expansão de US $ 3,2 bilhões.
| Segmento de seguro comercial | Valor de mercado | Taxa de crescimento |
|---|---|---|
| Mercado global de seguros para pequenas empresas | US $ 42,3 bilhões | 8.5% |
| Oportunidade de seguro comercial de Allstate | US $ 3,2 bilhões | Expansão potencial |
A Allstate Corporation (All) - Análise SWOT: Ameaças
Frequência crescente e gravidade dos desastres naturais
Em 2023, as perdas naturais de desastres nos Estados Unidos totalizaram US $ 57,1 bilhões, com as reivindicações de seguro imobiliário impactaram significativamente. O segmento de seguros de propriedades e vítimas da Allstate teve desafios substanciais.
| Tipo de desastre natural | Impacto financeiro estimado | Frequência de reivindicações |
|---|---|---|
| Furacões | US $ 26,5 bilhões | Aumentou 22% |
| Incêndios florestais | US $ 11,3 bilhões | Aumentou 15% |
| Tempestades severas | US $ 19,2 bilhões | Aumentou 28% |
Concorrência intensa no mercado de seguros
O mercado de seguros demonstra aumentar as pressões competitivas, com plataformas digitais ganhando participação de mercado.
- Crescimento do mercado de plataformas de seguro digital: 35% anualmente
- Vendas de apólice de seguro on -line: US $ 45,6 bilhões em 2023
- Investimentos de inicialização da InsurTech: US $ 7,2 bilhões em capital de risco
Potencial crise econômica
Os indicadores econômicos sugerem possíveis desafios para os gastos com consumidores de seguros.
| Indicador econômico | 2023 valor | Impacto potencial |
|---|---|---|
| Índice de confiança do consumidor | 61.3 | Redução potencial nas compras de seguros |
| Taxa de desemprego | 3.7% | Potencial diminuição dos gastos discricionários |
Interrupções tecnológicas
As startups InsurTech continuam a desafiar os modelos de negócios de seguros tradicionais.
- Plataformas de seguro orientadas pela IA: 42% de penetração no mercado
- Blockchain Insurance Solutions: investimento de US $ 1,5 bilhão
- Processamento de reivindicações de aprendizado de máquina: melhoria de 28% de eficiência
Custos de saúde crescentes e reparos automáticos
Os custos que aumentam afetam significativamente as despesas de reivindicação de seguro.
| Categoria de custo | 2023 Aumento | Impacto projetado |
|---|---|---|
| Custos de tratamento médico | 7.3% | Reclamações de seguro de saúde mais altas |
| Despesas de reparo de automóveis | 6.9% | Custos de reclamação de seguro automóvel aumentados |
The Allstate Corporation (ALL) - SWOT Analysis: Opportunities
Expanding telematics adoption (Drivewise) to improve risk selection
The biggest near-term opportunity for The Allstate Corporation is the continued, aggressive expansion of its telematics (usage-based insurance) programs, primarily Drivewise. You've seen the impact of sophisticated data on underwriting, and this is where the rubber meets the road-literally.
The data shows a clear advantage: customers who opt into the Drivewise app are 25% less likely to be involved in a serious collision than those who do not. That translates directly into lower loss costs and improved underwriting profitability. The subsidiary Arity, which powers this data, is also a growing revenue stream, generating $79 million in Q1 2025 revenue.
The penetration rate for new auto business is strong but still has significant room to grow. New business penetration sits at 30% in states offering one telematics program, and it reaches 40% where both Drivewise and Milewise are available. For your online channel, new business penetration is already over 50%. The clear action here is pushing that 40% new business adoption rate closer to the online channel's 50%+ across all distribution channels, especially as the data shows Drivewise customers are safer drivers, handling their phones 44% less while driving.
Growth in protection products and non-insurance services like identity protection
The Protection Services segment is a crucial, high-growth area that diversifies revenue away from the volatile property-casualty (P&C) cycle. This segment, which includes Allstate Protection Plans and Allstate Roadside, is a predictable source of income, and it's expanding fast.
In Q2 2025, this segment reported revenues of $867 million, marking a 12.2% year-over-year increase. This growth accelerated into Q3 2025, with revenues climbing to $902 million, a 9.7% increase over the prior year quarter. The core driver is Allstate Protection Plans, which saw international revenues jump 30% in Q2 2025. This is a high-margin business, delivering $60 million in adjusted net income in Q2 2025.
The sheer volume of embedded protection is staggering: Protection Plans grew by 10% to 160 million items in force in 2024. This volume provides a massive base for cross-selling and bundling, which is defintely a key strategic opportunity.
Strategic divestitures to simplify operations and focus on core P&C
The strategic exit from lower-return, non-core businesses is a massive opportunity to simplify the balance sheet and reallocate capital to the P&C and Protection Services segments. The company has been executing on this plan, completing the divestiture of its Health and Benefits unit.
The sale of the Employer Voluntary Benefits business closed in Q1 2025 for $2.0 billion. Following this, the sale of the Group Health business closed on July 1, 2025, for $1.25 billion. The combined transaction proceeds from these divestitures total a substantial $3.25 billion. This capital is now deployable for higher-return investments, share repurchases, and core business growth.
Here's the quick math on the immediate financial benefit: the Employer Voluntary Benefits sale alone generated a $643 million after-tax gain recorded in Q2 2025. The Group Health divestiture is projected to yield a financial book gain of around $500 million. This is a clean-up that boosts capital efficiency.
| Divestiture Transaction | Closing Date (2025) | Total Proceeds | Financial Gain (Est./Actual) |
|---|---|---|---|
| Employer Voluntary Benefits | Q1 2025 | $2.0 billion | $643 million after-tax gain (Q2 2025) |
| Group Health Business | July 1, 2025 | $1.25 billion | ~$500 million financial book gain (Projected) |
| Total Health & Benefits Unit | N/A | $3.25 billion | ~$1.143 billion |
Potential for further premium rate increases to offset claims inflation
The ability to secure and implement rate increases remains a critical lever for margin recovery in the core P&C business. While loss cost trends are starting to moderate, the cumulative effect of past inflation still requires pricing discipline.
The Allstate Corporation has successfully driven up its earned premiums. Property-Liability earned premiums increased 7.5% to $14.3 billion in Q2 2025 and 6.1% to $14.5 billion in Q3 2025. This is a direct result of the rate actions taken over the past two years.
You need to keep an eye on the state-level approvals, as they are the source of the margin recovery. For example, a homeowners insurance rate increase averaging 34% was approved in California in 2024. The average gross written premium for homeowners insurance was up 12.4% in February 2024 compared to the prior year, reflecting both rate increases and inflation in home replacement costs. This momentum of rate adequacy is finally translating into policy growth, with auto insurance policies in force growing 1.9% over the prior year when excluding the heavily regulated markets of New York and New Jersey.
The Allstate Corporation (ALL) - SWOT Analysis: Threats
Persistent claims severity and frequency, especially in personal auto lines
You've seen Allstate Corporation's underwriting results improve dramatically in 2025, but don't mistake that for the underlying claims environment suddenly becoming easy. While the recorded auto insurance combined ratio improved to a strong 82.0% in the third quarter of 2025, this was significantly helped by a 5.0-point benefit from $480 million in favorable prior-year reserve reestimates in personal auto injury and physical damage coverages. This is a one-time gain, not a permanent trend change.
The core issue of claims severity (the cost per claim) remains a threat. Industry data leading into 2025 showed bodily injury severity jumping 9.2% and property damage severity climbing 2.5% year-over-year. Even with Allstate's internal improvements and rate increases, the cost of auto parts, labor, and medical expenses continues to inflate faster than general consumer prices. That means the company must keep its foot on the gas with pricing and risk selection, or its combined ratio could quickly revert to unprofitable levels.
Intensifying competition from GEICO and Progressive on price
The direct-to-consumer giants, GEICO and Progressive, continue to threaten Allstate's market share with aggressive pricing and massive advertising spend. Progressive, in particular, is leaning into growth, spending an estimated $1.3 billion on advertising in the third quarter of 2025 alone, which is 10% higher than the comparable quarter last year. GEICO, with its lower overhead from a direct model, consistently acts as the price leader for clean-record drivers.
While Allstate's underwriting performance is currently better-its Q3 2025 auto combined ratio was 82.0% versus Progressive's personal auto combined ratio of 90.7%-this profitability comes at the cost of slower policy growth. Allstate's strategy is to prioritize profit over volume, but this opens the door for competitors to poach price-sensitive customers. Progressive is even filing for auto insurance rate reductions in key markets like Florida, which puts immediate pressure on Allstate's ability to maintain its premium levels.
Adverse regulatory changes limiting rate hikes in high-loss states
The ability to raise rates to keep pace with rising claims costs is not guaranteed; it's a political negotiation, and regulators in high-loss states are pushing back. Allstate has successfully secured significant rate increases-like the 30% auto rate hike in California in early 2024-but these approvals often come with strings attached, such as a temporary prohibition on subsequent filings.
This regulatory friction forces Allstate to pull back from unprofitable markets. For example, in the second quarter of 2025, policy growth was hampered by reductions in states like New York and New Jersey, where regulatory requests were pending. More concerning is the risk of 'profitability clawbacks' (excess profits statutes) in states like Florida, where a competitor like Progressive had to accrue a massive $950 million policyholder expense in Q3 2025 because their profits exceeded a state-mandated threshold. That is a clear and present risk to underwriting income.
Here's the quick math on regulatory pressure:
- California Auto Rate Hike: +30% (Early 2024), but with a subsequent filing freeze.
- Florida Regulatory Risk: Competitor accrued $950 million expense in Q3 2025 due to excess profits.
- New York/New Jersey: Policy counts reduced in Q2 2025 due to slow rate approvals.
Climate change increasing the cost of severe weather events
Climate change is no longer a long-term risk; it is a budget line item that is volatile and escalating. The frequency and severity of severe convective storms (wind, hail, and tornadoes) and wildfires continue to drive massive catastrophe losses (Cat losses) for Allstate, particularly in the homeowners business.
The total estimated pre-tax catastrophe losses for the first five months of 2025 alone approached $2.54 billion. This volatility makes earnings unpredictable. For instance, the first quarter of 2025 saw net Cat losses hit $2.2 billion, driven in part by approximately $1.07 billion in losses related to California wildfires. This is the new normal, and it requires ever-increasing reinsurance costs to manage the risk, which eats into underwriting margin.
This table maps the 2025 catastrophe loss threat:
| Period | Pre-Tax Catastrophe Losses (Estimated) | Key Drivers |
|---|---|---|
| Q1 2025 (Net) | $2.2 billion | California Wildfires (approx. $1.07 billion) |
| Q2 2025 (Pre-Tax) | $1.99 billion | Severe wind and hail events |
| Q3 2025 (Pre-Tax) | $558 million | Wind and hail events |
| Jan - May 2025 (Pre-Tax) | Approached $2.54 billion | Wildfires, wind, and hail storms |
Disclaimer
All information, articles, and product details provided on this website are for general informational and educational purposes only. We do not claim any ownership over, nor do we intend to infringe upon, any trademarks, copyrights, logos, brand names, or other intellectual property mentioned or depicted on this site. Such intellectual property remains the property of its respective owners, and any references here are made solely for identification or informational purposes, without implying any affiliation, endorsement, or partnership.
We make no representations or warranties, express or implied, regarding the accuracy, completeness, or suitability of any content or products presented. Nothing on this website should be construed as legal, tax, investment, financial, medical, or other professional advice. In addition, no part of this site—including articles or product references—constitutes a solicitation, recommendation, endorsement, advertisement, or offer to buy or sell any securities, franchises, or other financial instruments, particularly in jurisdictions where such activity would be unlawful.
All content is of a general nature and may not address the specific circumstances of any individual or entity. It is not a substitute for professional advice or services. Any actions you take based on the information provided here are strictly at your own risk. You accept full responsibility for any decisions or outcomes arising from your use of this website and agree to release us from any liability in connection with your use of, or reliance upon, the content or products found herein.