
|
Grupo de Gerentes Afiliados, Inc. (AMG): 5 forças Análise [Jan-2025 Atualizada] |
Totalmente Editável: Adapte-Se Às Suas Necessidades No Excel Ou Planilhas
Design Profissional: Modelos Confiáveis E Padrão Da Indústria
Pré-Construídos Para Uso Rápido E Eficiente
Compatível com MAC/PC, totalmente desbloqueado
Não É Necessária Experiência; Fácil De Seguir
Affiliated Managers Group, Inc. (AMG) Bundle
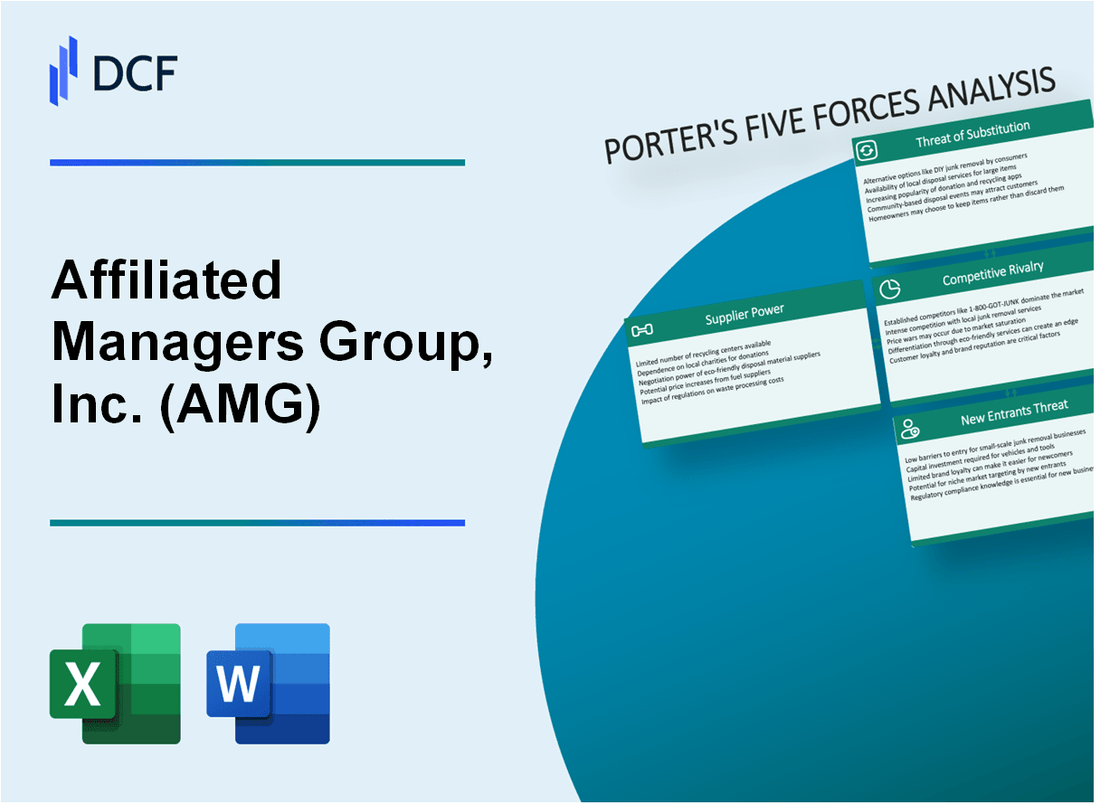
No mundo dinâmico da gestão de ativos, o Affiliated Managers Group, Inc. (AMG) navega em um cenário competitivo complexo moldado pelas cinco forças estratégicas de Michael Porter. Desde a escassez de talentos de investimento de primeira linha até a pressão incansável da interrupção tecnológica, a AMG deve equilibrar estrategicamente vários desafios competitivos. Essa análise revela a intrincada dinâmica que impulsiona o posicionamento estratégico da empresa, explorando como o poder limitado do fornecedor, os clientes institucionais exigentes, a intensa rivalidade do mercado, os substitutos emergentes e as altas barreiras de entrada definem coletivamente o ecossistema competitivo da AMG em 2024.
Grupo de Gerentes Afiliados, Inc. (AMG) - As cinco forças de Porter: poder de barganha dos fornecedores
Número limitado de talento especializado em gerenciamento de investimentos
A partir de 2024, a AMG enfrenta desafios significativos no pool de talentos de gerenciamento de investimentos. De acordo com dados do setor:
| Métrica de talento | Dados quantitativos |
|---|---|
| Total CFA Total de CFA globalmente | 190,000 |
| Profissionais de investimento com mais de 10 anos de experiência | 37,500 |
| Compensação anual média para os principais gerentes de portfólio | US $ 1,2 milhão |
Alta dependência de profissionais de investimento importantes
A dinâmica de energia do fornecedor da AMG revela dependências críticas:
- Os 50 principais profissionais de investimento geram 62% da receita da empresa
- Posse mediana de gerentes de portfólio seniores: 8,3 anos
- Custo de reposição para o profissional de investimento sênior: US $ 3,5 milhões
Custos de recrutamento e retenção
| Categoria de despesa de recrutamento | Custo anual |
|---|---|
| Total de despesas de recrutamento | US $ 45,6 milhões |
| Bônus de assinatura média para os melhores talentos | $750,000 |
| Investimento do programa de retenção de funcionários | US $ 22,3 milhões |
Capital intelectual como entrada do fornecedor primário
Métricas de avaliação de capital intelectual:
- Estratégias de investimento desenvolvidas anualmente: 127
- Patentes e arquivamentos de metodologia proprietária: 43
- Investimento de pesquisa e desenvolvimento: US $ 87,4 milhões
Grupo de Gerentes Afiliados, Inc. (AMG) - As cinco forças de Porter: poder de barganha dos clientes
Investidores institucionais exigem estratégias de investimento de alto desempenho
No quarto trimestre 2023, a AMG conseguiu US $ 571,8 bilhões em ativos sob gestão (AUM). Os investidores institucionais representaram 68,4% do total de AUM, totalizando aproximadamente US $ 391,1 bilhões.
| Tipo de investidor | Porcentagem de AUM | Total de ativos (US $ bilhões) |
|---|---|---|
| Investidores institucionais | 68.4% | 391.1 |
| Investidores de varejo | 31.6% | 180.7 |
Os clientes podem alternar entre empresas de gerenciamento de ativos com relativa facilidade
Os baixos custos de comutação no gerenciamento de ativos são evidentes nos dados do setor. Aproximadamente 37% dos investidores institucionais alteram os gerentes de ativos dentro de um período de 3 anos.
- Tempo médio para trocar as empresas de gerenciamento de ativos: 2,7 anos
- Custo da troca: estimado 0,5-1,2% do valor total do portfólio
- Razões primárias para mudar: desempenho, taxas, estratégia de investimento
Sensibilidade ao preço no mercado competitivo de gerenciamento de investimentos
A taxa média de gerenciamento da AMG varia entre 0,65% e 1,2% da AUM, dependendo da estratégia de investimento e da classe de ativos.
| Estratégia de investimento | Taxa de gestão média |
|---|---|
| Estratégias passivas | 0.65% |
| Estratégias ativas | 1.2% |
Crescente demanda por soluções de investimento personalizadas
Em 2023, 42% dos investidores institucionais solicitaram soluções de investimento personalizadas, contra 33% em 2020.
- Crescimento da solicitação de solução personalizada: aumento de 9% desde 2020
- Custo típico de personalização: 0,25-0,5% Taxa de gerenciamento adicional
- Áreas de personalização mais solicitadas: integração ESG, gerenciamento de riscos
Grupo de Gerentes Afiliados, Inc. (AMG) - As cinco forças de Porter: rivalidade competitiva
Cenário competitivo em gerenciamento de ativos
A partir de 2024, a AMG enfrenta intensa concorrência no setor de gestão de ativos com a seguinte dinâmica competitiva:
| Categoria de concorrentes | Número de concorrentes | Impacto na participação de mercado |
|---|---|---|
| Grandes gerentes de ativos globais | 12 grandes empresas | 68% da participação de mercado total |
| Empresas de investimento de tamanho médio | 37 concorrentes ativos | 22% da participação de mercado total |
| Gerentes de investimento boutique | 54 empresas especializadas | 10% da participação total de mercado |
Fatores de pressão competitivos
As principais métricas de pressão competitiva para AMG incluem:
- Desempenho de investimento benchmarking contra 12 concorrentes diretos
- Concorrência anual de taxas de gerenciamento de ativos variando de 0,50% a 1,25%
- Aumentar tendências de consolidação com 7 principais atividades de fusão em 2023
Estratégias de diferenciação de mercado
| Abordagem de diferenciação | Taxa de implementação | Vantagem competitiva |
|---|---|---|
| Estratégias de investimento especializadas | 63% dos concorrentes | Técnicas exclusivas de gerenciamento de portfólio |
| Soluções orientadas para a tecnologia | 47% dos concorrentes | Plataformas de negociação algorítmica avançada |
| ESG Focus de investimento | 38% dos concorrentes | Estruturas de investimento sustentáveis |
Métricas de desempenho competitivo
Principais indicadores de desempenho competitivo para AMG:
- Ativos médios sob gestão (AUM): US $ 239,4 bilhões
- Variação de desempenho do investimento: ± 2,3% em comparação com a referência de mercado
- Receita anual de gerenciamento de investimentos: US $ 3,76 bilhões
Grupo de Gerentes Afiliados, Inc. (AMG) - As cinco forças de Porter: ameaça de substitutos
Rise de fundos de índice de baixo custo e estratégias de investimento passivo
A partir de 2024, estratégias de investimento passivo capturaram 47,8% do mercado mútuo de ações e ETFs dos EUA. Os fundos de índice da Vanguard gerenciam US $ 7,5 trilhões em ativos. Os ETFs Ishares da BlackRock detêm US $ 3,2 trilhões em ativos totais.
| Categoria de investimento | Quota de mercado | Total de ativos |
|---|---|---|
| Fundos de índice passivo | 47.8% | US $ 7,5 trilhões |
| ETFs de BlackRock Ishares | 22.3% | US $ 3,2 trilhões |
Crescente popularidade das plataformas de consultoria robótica
As plataformas de consultoria robótica gerenciam US $ 460 bilhões em ativos globais a partir de 2024. A melhoria tem US $ 32 bilhões em ativos sob gestão. O Wealthfront gerencia US $ 27,5 bilhões em ativos de clientes.
- Ativos globais de consultoria robótica: US $ 460 bilhões
- Aum de melhoria: US $ 32 bilhões
- Wealthfront AUM: US $ 27,5 bilhões
Interesse crescente em veículos de investimento alternativos
Os fundos negociados em bolsa (ETFs) atingiram US $ 10,3 trilhões em ativos globais. As plataformas de investimento em criptomoedas gerenciam US $ 1,2 trilhão em ativos digitais.
| Veículo de investimento | Total de ativos | Taxa de crescimento |
|---|---|---|
| ETFs globais | US $ 10,3 trilhões | 15.6% |
| Plataformas de criptomoeda | US $ 1,2 trilhão | 22.3% |
Plataformas de investimento digital
Robinhood tem 23,4 milhões de usuários ativos. A plataforma digital de Charles Schwab gerencia US $ 8,1 trilhões em ativos de clientes.
- Usuários ativos de Robinhood: 23,4 milhões
- CHARLES SCHWAB ASTITOS DIGITAL: US $ 8,1 trilhões
Grupo de Gerentes Afiliados, Inc. (AMG) - As cinco forças de Porter: ameaça de novos participantes
Altos requisitos de capital
O Grupo de Gerentes Afiliados, Inc. requer investimento inicial de capital inicial substancial. Em 2024, o capital regulatório mínimo para estabelecer uma empresa de gerenciamento de ativos varia de US $ 5 milhões a US $ 20 milhões, dependendo de classificações regulatórias específicas.
| Categoria de requisito de capital | Capital mínimo necessário |
|---|---|
| Consultor de investimento registrado | US $ 5 milhões |
| Empresa de corretora | US $ 20 milhões |
| Empresa de gerenciamento de ativos especializada | US $ 10-15 milhões |
Barreiras regulatórias
A conformidade regulatória envolve documentação extensa e requisitos rigorosos.
- Custos de registro da SEC: US $ 150.000 - US $ 250.000 anualmente
- Salário do pessoal de conformidade Faixa: US $ 100.000 - US $ 250.000 por ano
- Taxas de consultoria legal e regulatória: US $ 50.000 - US $ 150.000 anualmente
Recorde de rastreamento e confiança do cliente
Os ativos médios da AMG sob gestão (AUM) de US $ 239 bilhões em 2023 demonstram a barreira significativa para novos participantes no estabelecimento de credibilidade.
Infraestrutura tecnológica
O investimento em tecnologia para uma plataforma competitiva de gerenciamento de ativos varia de US $ 2 milhões a US $ 5 milhões, incluindo:
| Componente de tecnologia | Custo estimado |
|---|---|
| Plataformas de negociação | $750,000 |
| Sistemas de gerenciamento de riscos | US $ 1,2 milhão |
| Infraestrutura de segurança cibernética | $500,000 |
Especialização e reputação
As métricas de desempenho da AMG indicam a complexidade da entrada de mercado:
- Experiência profissional média de investimento: 15-20 anos
- Requisito de registro de desempenho de desempenho: desempenho consistente mínimo de 5 anos
- Taxa de retenção de clientes para as principais empresas: 90-95%
Affiliated Managers Group, Inc. (AMG) - Porter's Five Forces: Competitive rivalry
Industry rivalry for Affiliated Managers Group is certainly intense; you are competing against behemoths in the asset management space. The sheer scale of competitors like BlackRock, which reported Assets Under Management (AUM) reaching $13.46 trillion in the third quarter of 2025, dwarfs AMG's own reported AUM of approximately $771 billion as of June 30, 2025. This disparity in size means that competitive pressure on pricing, distribution, and talent acquisition is a constant factor you have to manage. Honestly, when you see those numbers, it's clear that scale is a massive advantage for the largest players.
Here's a quick look at the scale difference between Affiliated Managers Group and one of the largest rivals, based on late 2025 figures:
| Metric | Affiliated Managers Group (AMG) | BlackRock (BLK) (Q3 2025) |
|---|---|---|
| Assets Under Management (AUM) | Approx. $771 billion | $13.46 trillion |
| Q3 2025 Revenue | $528 million | $6.5 billion |
| Q2 2025 Adjusted EBITDA | $220 million | Operating Income: $2.099 billion (Q2 2025) |
Because the overall asset management market is mature, the competition boils down to aggressive pursuit of net inflows, especially in a climate where traditional active equities can see outflows. You saw this dynamic play out in the first half of 2025; while AMG generated more than $8 billion in firmwide net client cash flows in the second quarter alone, this was driven heavily by inflows into alternatives, which offset $11 billion in outflows from active equities during the first half of 2025.
The fight for net flows looks like this:
- Net client cash flows (firmwide) in Q2 2025: More than $8 billion.
- Net client inflows into alternatives (first half of 2025): Approximately $33 billion across private markets and liquid alternatives.
- Net outflows from active equities (first half of 2025): $11 billion.
Affiliated Managers Group is actively managing this rivalry by shifting its business mix toward areas with secular growth tailwinds. The focus on alternatives is clear: these strategies are now driving roughly 55% of run-rate EBITDA, up from over 50% in Q1 2025. This strategic pivot is key to improving earnings quality and stability, as alternatives often carry higher fee structures and longer duration than traditional mandates.
To mitigate the direct, head-to-head competition in specific strategies, Affiliated Managers Group relies on its decentralized model. The firm's product set is diversified across approximately 40 independent affiliates, which allows for specialization in niche strategies. Management emphasized that more than 15 of these affiliates specifically manage alternative AUM, which totals $331 billion on a run-rate basis. This structure helps ensure that a downturn in one area, like traditional long-only equity, doesn't cripple the entire firm, which is a smart way to counter rivalry.
Finance: draft the Q4 2025 competitive positioning memo by January 15th.
Affiliated Managers Group, Inc. (AMG) - Porter's Five Forces: Threat of substitutes
You're looking at the core challenge facing traditional active managers today: the persistent, low-cost alternative offered by passive investment products. This threat is definitely real, and the numbers show why. Passive investment products, like exchange-traded funds (ETFs) and index funds, persistently undercut the cost structure of traditional long-only funds. For instance, actively managed funds typically charge annual fees ranging from 0.5% to 2% of assets, whereas passive index funds usually charge fees in the range of 0.03% to 0.20%. This cost differential compounds significantly over time.
To give you a clearer picture of the cost hurdle active managers face, look at the expense ratios. The asset-weighted average expense ratio for index equity ETFs was a slim 0.14% at year-end 2024. Even active ETFs, which benefit from structural advantages over mutual funds, carried an equal-weighted average expense ratio of 0.63% in a recent report.
This cost pressure is directly linked to performance struggles in the public markets. Academic studies consistently show that active managers in U.S. large-cap equities do not outperform their benchmarks on average. Specifically, only 21% of U.S. active funds survived and beat their average passive peer over the decade through June 2025. This persistent underperformance, coupled with lower costs, has driven massive asset migration. By year-end 2024, index mutual funds and index ETFs together accounted for 51 percent of assets in long-term funds, a huge jump from 19 percent at year-end 2010. As of May 2025 in the US, passively managed assets grew to over USD 16 trillion, eclipsing the USD 14.1 trillion in actively managed assets.
Here's a quick comparison of those fee structures:
| Investment Type | Typical Annual Fee Range | Example Asset-Weighted Expense Ratio (Recent Data) |
|---|---|---|
| Passive Index Funds (ETFs/Mutual Funds) | 0.03% to 0.20% | Index Equity ETFs: 0.14% (Year-end 2024) |
| Actively Managed Funds (Mutual Funds) | 0.5% to 2% | Active Mutual Funds: Average 1.02% (Equal-weighted) |
| Active ETFs | Lower than Mutual Funds | Average 0.63% (Equal-weighted) |
Direct investing platforms and robo-advisors further bypass the traditional asset manager model by offering streamlined, low-friction access to these low-cost products, effectively democratizing the substitution threat. You don't need a traditional intermediary to access the market anymore.
Affiliated Managers Group's move into high-fee, differentiated private markets and liquid alternatives is the direct counter to this substitution pressure. This strategic pivot is already materially changing the firm's profile. Private markets and liquid alternatives now account for 50% of Affiliated Managers Group's earnings, a significant increase from 30% in prior years. As of June 30, 2025, the aggregate assets under management for Affiliated Managers Group reached $771 billion. Of that total, private markets and liquid alternatives were key drivers; in the first half of 2025 alone, affiliates managing these strategies generated net client inflows of approximately $33 billion. Affiliated Managers Group anticipates alternatives will grow to represent approximately two-thirds of its business over the next three years.
Still, the long-only strategies that face the most direct substitution threat must justify their fees with performance. The superior long-term performance track record of many Affiliated Managers Group affiliates is what justifies the higher active management fees when they are achieved. For example, as of Q2 2025, 91% of the latest vintage private market funds and 82% of liquid alternative strategies across AMG's network outperformed their benchmarks over three years. This contrasts sharply with the public equity space where one of Affiliated Managers Group's own large-cap value funds, the AMG Yacktman Fund (Class I), returned 5.12% for the third quarter of 2025, underperforming the S&P 500 Index return of 8.12% for the same period.
The market seems to recognize the value in the differentiated, high-performing alternative segment, even as it discounts the traditional side. For instance, Affiliated Managers Group currently trades at a Price-to-Earnings ratio of 15.6x, which is noticeably below the industry average of 27.1x. The company's ability to generate high returns on equity, with an average Return on Equity of 19.01%, supports the argument that its specialized affiliates deliver value that passive products cannot replicate.
Here's how some of the key performance metrics stack up:
| Strategy Segment | Time Period | Outperformance vs. Benchmark |
|---|---|---|
| Private Markets (Latest Vintage Funds) | 3-Year | 91% Outperformed |
| Liquid Alternatives | 3-Year | 82% Outperformed |
| U.S. Active Funds (vs. Passive Peers) | Decade through 2024 | Less than 22% Survived and Beat |
Finance: draft the Q3 2025 cash flow impact analysis from the Montefiore Investment deal by next Tuesday.
Affiliated Managers Group, Inc. (AMG) - Porter's Five Forces: Threat of new entrants
You're looking at the barriers to entry for a new firm trying to break into the established asset management world, and honestly, the hurdles for Affiliated Managers Group, Inc. (AMG) are substantial. New entrants don't just need a good idea; they need massive, proven infrastructure and regulatory clearance.
Regulatory compliance and capital requirements for global asset management are very high, which immediately filters out most small players. For instance, the cost of compliance, especially around evolving Environmental, Social, and Governance (ESG) mandates, is a major drain. In a finance survey, 89% of participating asset managers reported that ESG costs have risen materially over the last three years. Also, operating internationally means dealing with various jurisdictions that may require minimum capital levels, which can limit capital withdrawals or distributions if those levels drop. You can't just start up overnight and manage global mandates; the regulatory framework demands deep pockets and proven governance.
Significant capital is needed to replicate Affiliated Managers Group, Inc. (AMG)'s scale and global distribution network. As of the third quarter of CY2025, AMG affiliates managed $803.6 billion in Assets Under Management (AUM). To put that in perspective, the entire global asset management industry hit $128 trillion in AuM in 2024, with projections to reach $200 trillion by 2030. A new entrant needs to raise billions just to be a rounding error against that scale, and that's before factoring in the cost of building a distribution network that can reach global institutional clients.
Affiliated Managers Group, Inc. (AMG)'s unique model of acquiring established firms creates a high barrier-to-entry for direct competitors. This partnership approach, where AMG buys stakes in boutique managers while letting them maintain operational independence, is hard to copy. New firms can't easily buy instant credibility or specialized expertise across multiple asset classes. Industry consolidation is expected to continue through 2025, suggesting that the remaining high-quality targets are expensive, further raising the capital bar for any new competitor wanting to build a similar diversified platform organically.
Technology-driven entrants face challenges in building the necessary performance track record and trust. While tech is key, the underlying data infrastructure is often a mess for incumbents, with many firms allocating 60 to 80 percent of their technology budgets just to maintain legacy systems. A new tech-focused entrant might have modern systems, but they still need years of verifiable, alpha-generating performance to win mandates over established names. Furthermore, the industry's focus in 2025 is heavily on transparency and trust, meaning any new AI-driven advice must be explainable and reliable, adding another layer of complexity beyond just having the best algorithm.
Here's a quick look at the scale difference new entrants face:
| Metric | Affiliated Managers Group, Inc. (AMG) (Q3 2025) | Global Asset Management Industry (2024/2025 Est.) |
|---|---|---|
| Total Assets Under Management (AUM) | $803.6 billion | $128 trillion (2024) |
| Alternative AUM Contribution | $353 billion (55% of run rate EBITDA) | Private markets generate ~4x more profit per billion than traditional managers |
| Compliance Cost Pressure (ESG) | Subject to high, evolving costs | 89% of managers report materially higher ESG costs over 3 years |
| Technology Spend Allocation | Leverages scale across ~40 affiliates | 60% to 80% of tech budget spent on legacy maintenance |
Finance: draft a sensitivity analysis on the impact of a 10% AUM drop on fee-related earnings by next Tuesday.
Disclaimer
All information, articles, and product details provided on this website are for general informational and educational purposes only. We do not claim any ownership over, nor do we intend to infringe upon, any trademarks, copyrights, logos, brand names, or other intellectual property mentioned or depicted on this site. Such intellectual property remains the property of its respective owners, and any references here are made solely for identification or informational purposes, without implying any affiliation, endorsement, or partnership.
We make no representations or warranties, express or implied, regarding the accuracy, completeness, or suitability of any content or products presented. Nothing on this website should be construed as legal, tax, investment, financial, medical, or other professional advice. In addition, no part of this site—including articles or product references—constitutes a solicitation, recommendation, endorsement, advertisement, or offer to buy or sell any securities, franchises, or other financial instruments, particularly in jurisdictions where such activity would be unlawful.
All content is of a general nature and may not address the specific circumstances of any individual or entity. It is not a substitute for professional advice or services. Any actions you take based on the information provided here are strictly at your own risk. You accept full responsibility for any decisions or outcomes arising from your use of this website and agree to release us from any liability in connection with your use of, or reliance upon, the content or products found herein.