
|
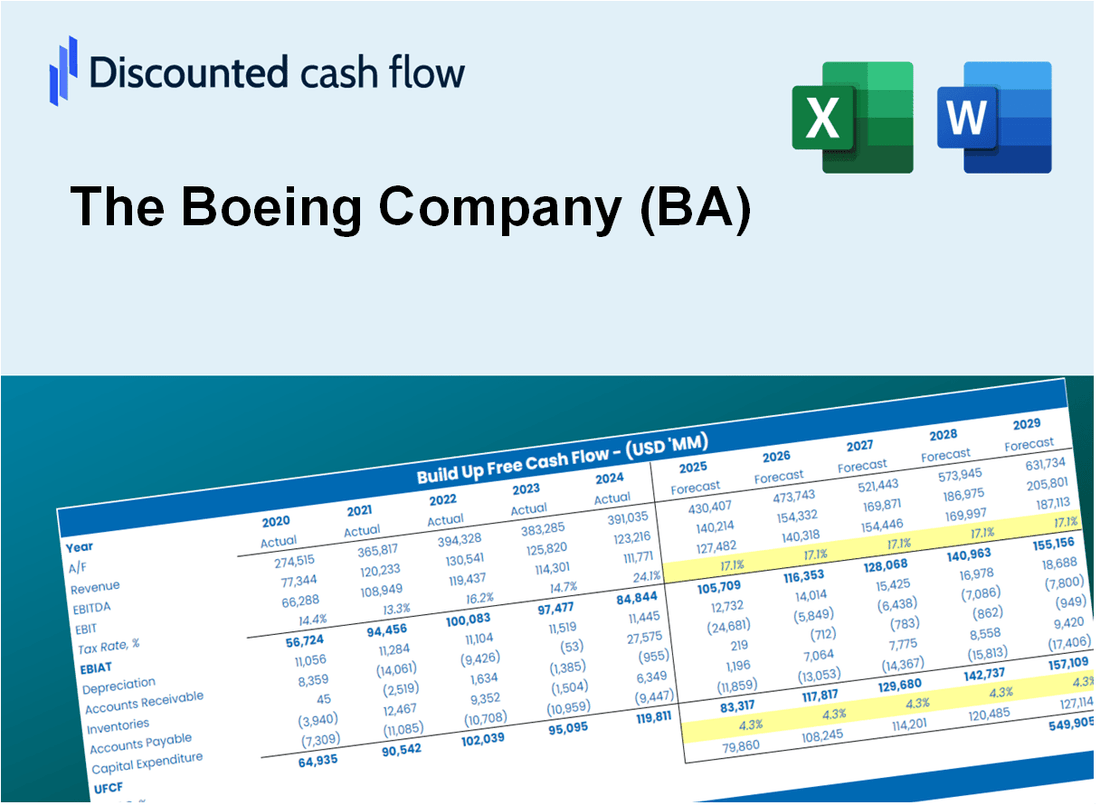
A avaliação DCF da Boeing Company (BA) |
Totalmente Editável: Adapte-Se Às Suas Necessidades No Excel Ou Planilhas
Design Profissional: Modelos Confiáveis E Padrão Da Indústria
Pré-Construídos Para Uso Rápido E Eficiente
Compatível com MAC/PC, totalmente desbloqueado
Não É Necessária Experiência; Fácil De Seguir
The Boeing Company (BA) Bundle
Aprimore sua estratégia de investimento com a calculadora DCF (BA)! Use dados financeiros reais da Boeing, ajuste as projeções e despesas de crescimento e observe instantaneamente como essas modificações influenciam o valor intrínseco de (BA).
What You Will Get
- Real BA Financial Data: Pre-filled with Boeing’s historical and projected data for precise analysis.
- Fully Editable Template: Modify key inputs like revenue growth, WACC, and EBITDA % with ease.
- Automatic Calculations: See Boeing’s intrinsic value update instantly based on your changes.
- Professional Valuation Tool: Designed for investors, analysts, and consultants seeking accurate DCF results.
- User-Friendly Design: Simple structure and clear instructions for all experience levels.
Key Features
- Pre-Loaded Data: Boeing's historical financial statements and pre-filled forecasts.
- Fully Adjustable Inputs: Modify WACC, tax rates, revenue growth, and EBITDA margins.
- Instant Results: Observe Boeing's intrinsic value recalculating in real time.
- Clear Visual Outputs: Dashboard charts present valuation results and key metrics.
- Built for Accuracy: A professional tool designed for analysts, investors, and finance experts.
How It Works
- Step 1: Download the Excel file for The Boeing Company (BA).
- Step 2: Review Boeing’s pre-filled financial data and forecasts.
- Step 3: Modify critical inputs like revenue growth, WACC, and tax rates (highlighted cells).
- Step 4: Watch the DCF model update instantly as you adjust your assumptions.
- Step 5: Analyze the outputs and leverage the results for your investment decisions.
Why Choose Boeing (BA)?
- Innovative Technology: Cutting-edge aerospace solutions that lead the industry.
- Global Reach: Extensive network and partnerships across the globe enhance service delivery.
- Commitment to Safety: Rigorous standards and practices ensure the highest level of safety for all products.
- Sustainable Practices: Focus on environmentally friendly initiatives and reducing carbon footprints.
- Expertise You Can Trust: Decades of experience in aviation and defense, backed by a strong reputation.
Who Should Use This Product?
- Individual Investors: Make informed decisions about buying or selling Boeing stock.
- Financial Analysts: Streamline valuation processes with ready-to-use financial models for Boeing (BA).
- Consultants: Deliver professional valuation insights to clients quickly and accurately, focusing on Boeing (BA).
- Business Owners: Understand how major aerospace companies like Boeing (BA) are valued to guide your own strategy.
- Finance Students: Learn valuation techniques using real-world data and scenarios related to Boeing (BA).
What the Template Contains
- Historical Data: Includes The Boeing Company's (BA) past financials and baseline forecasts.
- DCF and Levered DCF Models: Detailed templates to calculate The Boeing Company's (BA) intrinsic value.
- WACC Sheet: Pre-built calculations for Weighted Average Cost of Capital.
- Editable Inputs: Modify key drivers like growth rates, EBITDA %, and CAPEX assumptions.
- Quarterly and Annual Statements: A complete breakdown of The Boeing Company's (BA) financials.
- Interactive Dashboard: Visualize valuation results and projections dynamically.
Disclaimer
All information, articles, and product details provided on this website are for general informational and educational purposes only. We do not claim any ownership over, nor do we intend to infringe upon, any trademarks, copyrights, logos, brand names, or other intellectual property mentioned or depicted on this site. Such intellectual property remains the property of its respective owners, and any references here are made solely for identification or informational purposes, without implying any affiliation, endorsement, or partnership.
We make no representations or warranties, express or implied, regarding the accuracy, completeness, or suitability of any content or products presented. Nothing on this website should be construed as legal, tax, investment, financial, medical, or other professional advice. In addition, no part of this site—including articles or product references—constitutes a solicitation, recommendation, endorsement, advertisement, or offer to buy or sell any securities, franchises, or other financial instruments, particularly in jurisdictions where such activity would be unlawful.
All content is of a general nature and may not address the specific circumstances of any individual or entity. It is not a substitute for professional advice or services. Any actions you take based on the information provided here are strictly at your own risk. You accept full responsibility for any decisions or outcomes arising from your use of this website and agree to release us from any liability in connection with your use of, or reliance upon, the content or products found herein.