
|
Bloomin 'Brands, Inc. (BLMN) DCF Avaliação |
Totalmente Editável: Adapte-Se Às Suas Necessidades No Excel Ou Planilhas
Design Profissional: Modelos Confiáveis E Padrão Da Indústria
Pré-Construídos Para Uso Rápido E Eficiente
Compatível com MAC/PC, totalmente desbloqueado
Não É Necessária Experiência; Fácil De Seguir
Bloomin' Brands, Inc. (BLMN) Bundle
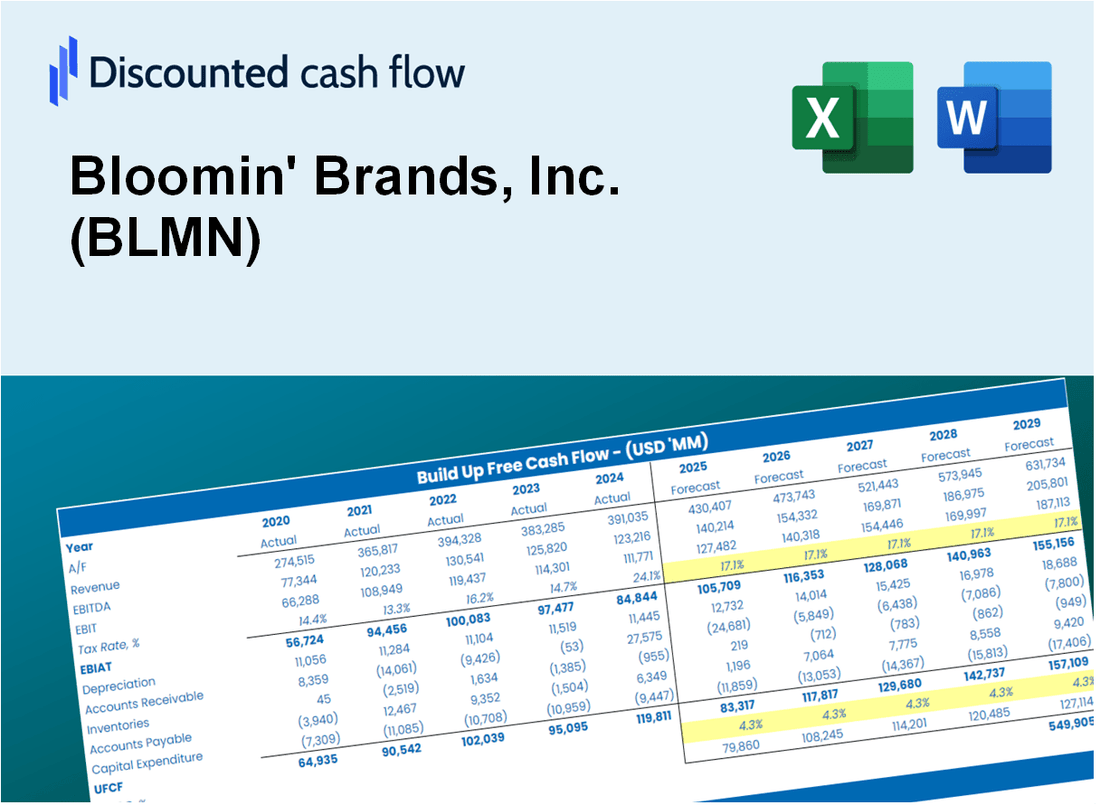
Obtenha informações sobre sua análise de avaliação Bloomin 'Brands, Inc. (BLMN) usando nossa calculadora DCF de última geração! Este modelo do Excel é pré -carregado com dados reais do BLMN, permitindo que você ajuste as previsões e suposições para determinar com precisão o valor intrínseco da Bloomin 'Brands, Inc. (BLMN).
Discounted Cash Flow (DCF) - (USD MM)
| Year | AY1 2020 |
AY2 2021 |
AY3 2022 |
AY4 2023 |
AY5 2024 |
FY1 2025 |
FY2 2026 |
FY3 2027 |
FY4 2028 |
FY5 2029 |
|---|---|---|---|---|---|---|---|---|---|---|
| Revenue | 3,170.6 | 4,122.4 | 4,009.3 | 4,168.2 | 3,950.5 | 4,207.4 | 4,481.1 | 4,772.6 | 5,083.0 | 5,413.6 |
| Revenue Growth, % | 0 | 30.02 | -2.74 | 3.96 | -5.22 | 6.5 | 6.5 | 6.5 | 6.5 | 6.5 |
| EBITDA | 5.2 | 470.3 | 330.7 | 452.0 | 179.4 | 296.2 | 315.5 | 336.0 | 357.9 | 381.2 |
| EBITDA, % | 0.16344 | 11.41 | 8.25 | 10.84 | 4.54 | 7.04 | 7.04 | 7.04 | 7.04 | 7.04 |
| Depreciation | 180.3 | 163.4 | 149.9 | 169.3 | 175.6 | 184.2 | 196.2 | 209.0 | 222.6 | 237.0 |
| Depreciation, % | 5.69 | 3.96 | 3.74 | 4.06 | 4.44 | 4.38 | 4.38 | 4.38 | 4.38 | 4.38 |
| EBIT | -175.1 | 306.9 | 180.8 | 282.8 | 3.8 | 112.0 | 119.3 | 127.1 | 135.3 | 144.1 |
| EBIT, % | -5.52 | 7.44 | 4.51 | 6.78 | 0.09583658 | 2.66 | 2.66 | 2.66 | 2.66 | 2.66 |
| Total Cash | 110.0 | 87.6 | 84.7 | 111.5 | 70.1 | 102.3 | 108.9 | 116.0 | 123.6 | 131.6 |
| Total Cash, percent | .0 | .0 | .0 | .0 | .0 | .0 | .0 | .0 | .0 | .0 |
| Account Receivables | 103.5 | 123.1 | 131.9 | 93.8 | 114.6 | 123.6 | 131.7 | 140.2 | 149.4 | 159.1 |
| Account Receivables, % | 3.26 | 2.99 | 3.29 | 2.25 | 2.9 | 2.94 | 2.94 | 2.94 | 2.94 | 2.94 |
| Inventories | 61.9 | 79.1 | 78.1 | 62.9 | 68.7 | 76.3 | 81.3 | 86.6 | 92.2 | 98.2 |
| Inventories, % | 1.95 | 1.92 | 1.95 | 1.51 | 1.74 | 1.81 | 1.81 | 1.81 | 1.81 | 1.81 |
| Accounts Payable | 141.5 | 168.0 | 183.7 | 155.9 | 153.2 | 174.5 | 185.8 | 197.9 | 210.8 | 224.5 |
| Accounts Payable, % | 4.46 | 4.07 | 4.58 | 3.74 | 3.88 | 4.15 | 4.15 | 4.15 | 4.15 | 4.15 |
| Capital Expenditure | -87.8 | -122.8 | -219.7 | -324.3 | -220.7 | -207.0 | -220.4 | -234.8 | -250.0 | -266.3 |
| Capital Expenditure, % | -2.77 | -2.98 | -5.48 | -7.78 | -5.59 | -4.92 | -4.92 | -4.92 | -4.92 | -4.92 |
| Tax Rate, % | -117.69 | -117.69 | -117.69 | -117.69 | -117.69 | -117.69 | -117.69 | -117.69 | -117.69 | -117.69 |
| EBITAT | -116.0 | 265.3 | 144.6 | 302.6 | 8.2 | 96.9 | 103.2 | 110.0 | 117.1 | 124.7 |
| Depreciation | ||||||||||
| Changes in Account Receivables | ||||||||||
| Changes in Inventories | ||||||||||
| Changes in Accounts Payable | ||||||||||
| Capital Expenditure | ||||||||||
| UFCF | -47.5 | 295.6 | 82.7 | 173.0 | -66.1 | 78.8 | 77.4 | 82.4 | 87.7 | 93.5 |
| WACC, % | 3.83 | 4.43 | 4.24 | 4.83 | 4.83 | 4.43 | 4.43 | 4.43 | 4.43 | 4.43 |
| PV UFCF | ||||||||||
| SUM PV UFCF | 367.8 | |||||||||
| Long Term Growth Rate, % | 2.00 | |||||||||
| Free cash flow (T + 1) | 95 | |||||||||
| Terminal Value | 3,921 | |||||||||
| Present Terminal Value | 3,157 | |||||||||
| Enterprise Value | 3,525 | |||||||||
| Net Debt | 2,205 | |||||||||
| Equity Value | 1,320 | |||||||||
| Diluted Shares Outstanding, MM | 86 | |||||||||
| Equity Value Per Share | 15.37 |
What You Will Get
- Real Bloomin' Brands Data: Preloaded financials – from revenue to EBIT – based on actual and projected figures for Bloomin' Brands, Inc. (BLMN).
- Full Customization: Adjust all critical parameters (yellow cells) like WACC, growth %, and tax rates to fit your analysis.
- Instant Valuation Updates: Automatic recalculations to assess the impact of changes on Bloomin' Brands' fair value.
- Versatile Excel Template: Designed for quick edits, scenario testing, and comprehensive projections tailored to Bloomin' Brands, Inc. (BLMN).
- Time-Saving and Accurate: Avoid building models from scratch while ensuring precision and flexibility in your evaluations.
Key Features
- Comprehensive DCF Calculator: Provides detailed unlevered and levered DCF valuation models tailored for Bloomin' Brands, Inc. (BLMN).
- WACC Calculator: Features a pre-built Weighted Average Cost of Capital sheet with customizable inputs specific to the restaurant industry.
- Customizable Forecast Assumptions: Adjust growth rates, capital expenditures, and discount rates to reflect market conditions.
- Integrated Financial Ratios: Evaluate profitability, leverage, and efficiency ratios relevant to Bloomin' Brands, Inc. (BLMN).
- Interactive Dashboard and Charts: Visual representations summarize key valuation metrics for straightforward analysis.
How It Works
- Step 1: Download the Excel file.
- Step 2: Review Bloomin' Brands, Inc.'s pre-filled financial data and forecasts.
- Step 3: Modify critical inputs like revenue growth, WACC, and tax rates (highlighted cells).
- Step 4: Watch the DCF model update instantly as you tweak assumptions.
- Step 5: Analyze the outputs and use the results for investment decisions.
Why Choose Bloomin' Brands, Inc. (BLMN)?
- Save Time: Instant access to comprehensive data without the hassle of manual research.
- Enhance Accuracy: Dependable financial insights and metrics minimize valuation discrepancies.
- Fully Customizable: Adjust the model to fit your specific market assumptions and forecasts.
- User-Friendly: Intuitive visuals and outputs simplify the analysis process.
- Endorsed by Professionals: Crafted for industry experts who prioritize accuracy and functionality.
Who Should Use Bloomin' Brands, Inc. (BLMN)?
- Investors: Gain insights into the restaurant industry with a trusted brand in your portfolio.
- Financial Analysts: Analyze performance metrics and trends with comprehensive financial reports.
- Consultants: Utilize market data and insights for effective client strategies in the dining sector.
- Food Enthusiasts: Explore the diverse menu offerings and innovative dining experiences Bloomin' Brands provides.
- Educators and Students: Use real-world case studies from Bloomin' Brands in hospitality and business courses.
What the Template Contains
- Historical Data: Includes Bloomin' Brands' past financials and baseline forecasts.
- DCF and Levered DCF Models: Detailed templates to calculate Bloomin' Brands' intrinsic value.
- WACC Sheet: Pre-built calculations for Weighted Average Cost of Capital.
- Editable Inputs: Modify key drivers like growth rates, EBITDA %, and CAPEX assumptions.
- Quarterly and Annual Statements: A complete breakdown of Bloomin' Brands' financials.
- Interactive Dashboard: Visualize valuation results and projections dynamically.
Disclaimer
All information, articles, and product details provided on this website are for general informational and educational purposes only. We do not claim any ownership over, nor do we intend to infringe upon, any trademarks, copyrights, logos, brand names, or other intellectual property mentioned or depicted on this site. Such intellectual property remains the property of its respective owners, and any references here are made solely for identification or informational purposes, without implying any affiliation, endorsement, or partnership.
We make no representations or warranties, express or implied, regarding the accuracy, completeness, or suitability of any content or products presented. Nothing on this website should be construed as legal, tax, investment, financial, medical, or other professional advice. In addition, no part of this site—including articles or product references—constitutes a solicitation, recommendation, endorsement, advertisement, or offer to buy or sell any securities, franchises, or other financial instruments, particularly in jurisdictions where such activity would be unlawful.
All content is of a general nature and may not address the specific circumstances of any individual or entity. It is not a substitute for professional advice or services. Any actions you take based on the information provided here are strictly at your own risk. You accept full responsibility for any decisions or outcomes arising from your use of this website and agree to release us from any liability in connection with your use of, or reliance upon, the content or products found herein.