
|
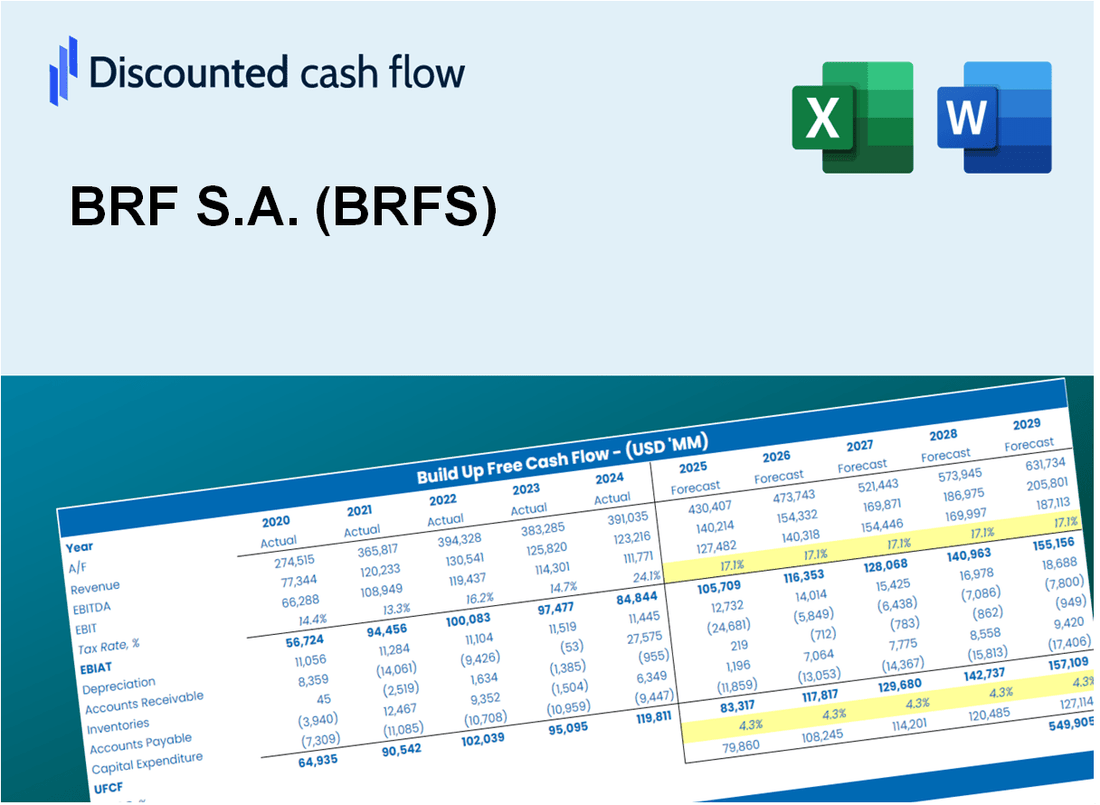
BRF S.A. (BRFS) DCF Valuation |
Totalmente Editável: Adapte-Se Às Suas Necessidades No Excel Ou Planilhas
Design Profissional: Modelos Confiáveis E Padrão Da Indústria
Pré-Construídos Para Uso Rápido E Eficiente
Compatível com MAC/PC, totalmente desbloqueado
Não É Necessária Experiência; Fácil De Seguir
BRF S.A. (BRFS) Bundle
Elevate your BRF S.A. (BRFS) valuation analysis using our sophisticated DCF Calculator! Preloaded with real BRFS data, this Excel template enables you to adjust forecasts and assumptions, allowing for precise calculation of BRF S.A.'s intrinsic value.
What You Will Receive
- Flexible Forecast Inputs: Easily adjust variables (growth %, margins, WACC) to explore different scenarios.
- Real-World Data: BRF S.A.’s financial data pre-loaded to enhance your analysis.
- Automated DCF Outputs: The template computes Net Present Value (NPV) and intrinsic value for you.
- Customizable and Professional: A refined Excel model that caters to your valuation requirements.
- Designed for Analysts and Investors: Perfect for testing projections, validating strategies, and optimizing your time.
Key Features
- 🔍 Real-Life BRFS Financials: Pre-filled historical and projected data for BRF S.A.
- ✏️ Fully Customizable Inputs: Adjust all critical parameters (yellow cells) like WACC, growth %, and tax rates.
- 📊 Professional DCF Valuation: Built-in formulas calculate BRF’s intrinsic value using the Discounted Cash Flow method.
- ⚡ Instant Results: Visualize BRF’s valuation instantly after making changes.
- Scenario Analysis: Test and compare outcomes for various financial assumptions side-by-side.
How It Works
- Step 1: Download the prebuilt Excel template featuring BRF S.A. (BRFS) data.
- Step 2: Review the pre-filled sheets to familiarize yourself with the essential metrics.
- Step 3: Modify forecasts and assumptions in the editable yellow cells (WACC, growth, margins).
- Step 4: Immediately see the recalculated results, including BRF S.A.'s (BRFS) intrinsic value.
- Step 5: Make well-informed investment decisions or create reports based on the generated outputs.
Why Choose BRF S.A. (BRFS)?
- Streamlined Operations: Benefit from efficient processes that save you valuable time.
- Enhanced Quality: Commitment to high standards ensures superior products and services.
- Adaptable Solutions: Customize offerings to meet your specific needs and market demands.
- User-Friendly Experience: Intuitive interfaces and resources make interactions straightforward.
- Industry Leader: Trusted by stakeholders for our dedication to excellence and innovation.
Who Should Use This Product?
- Professional Investors: Develop comprehensive and accurate valuation models for analyzing BRF S.A. (BRFS) investments.
- Corporate Finance Teams: Evaluate valuation scenarios to inform strategic decisions within the company.
- Consultants and Advisors: Deliver precise valuation insights for clients interested in BRF S.A. (BRFS).
- Students and Educators: Utilize real-world data to enhance learning and practice in financial modeling.
- Food Industry Analysts: Gain insights into how companies like BRF S.A. (BRFS) are valued in the market.
What the Template Contains
- Historical Data: Includes BRF S.A.'s past financials and baseline forecasts.
- DCF and Levered DCF Models: Detailed templates to calculate BRF S.A.'s intrinsic value.
- WACC Sheet: Pre-built calculations for Weighted Average Cost of Capital.
- Editable Inputs: Modify key drivers like growth rates, EBITDA %, and CAPEX assumptions.
- Quarterly and Annual Statements: A complete breakdown of BRF S.A.'s financials.
- Interactive Dashboard: Visualize valuation results and projections dynamically.
Disclaimer
All information, articles, and product details provided on this website are for general informational and educational purposes only. We do not claim any ownership over, nor do we intend to infringe upon, any trademarks, copyrights, logos, brand names, or other intellectual property mentioned or depicted on this site. Such intellectual property remains the property of its respective owners, and any references here are made solely for identification or informational purposes, without implying any affiliation, endorsement, or partnership.
We make no representations or warranties, express or implied, regarding the accuracy, completeness, or suitability of any content or products presented. Nothing on this website should be construed as legal, tax, investment, financial, medical, or other professional advice. In addition, no part of this site—including articles or product references—constitutes a solicitation, recommendation, endorsement, advertisement, or offer to buy or sell any securities, franchises, or other financial instruments, particularly in jurisdictions where such activity would be unlawful.
All content is of a general nature and may not address the specific circumstances of any individual or entity. It is not a substitute for professional advice or services. Any actions you take based on the information provided here are strictly at your own risk. You accept full responsibility for any decisions or outcomes arising from your use of this website and agree to release us from any liability in connection with your use of, or reliance upon, the content or products found herein.