
|
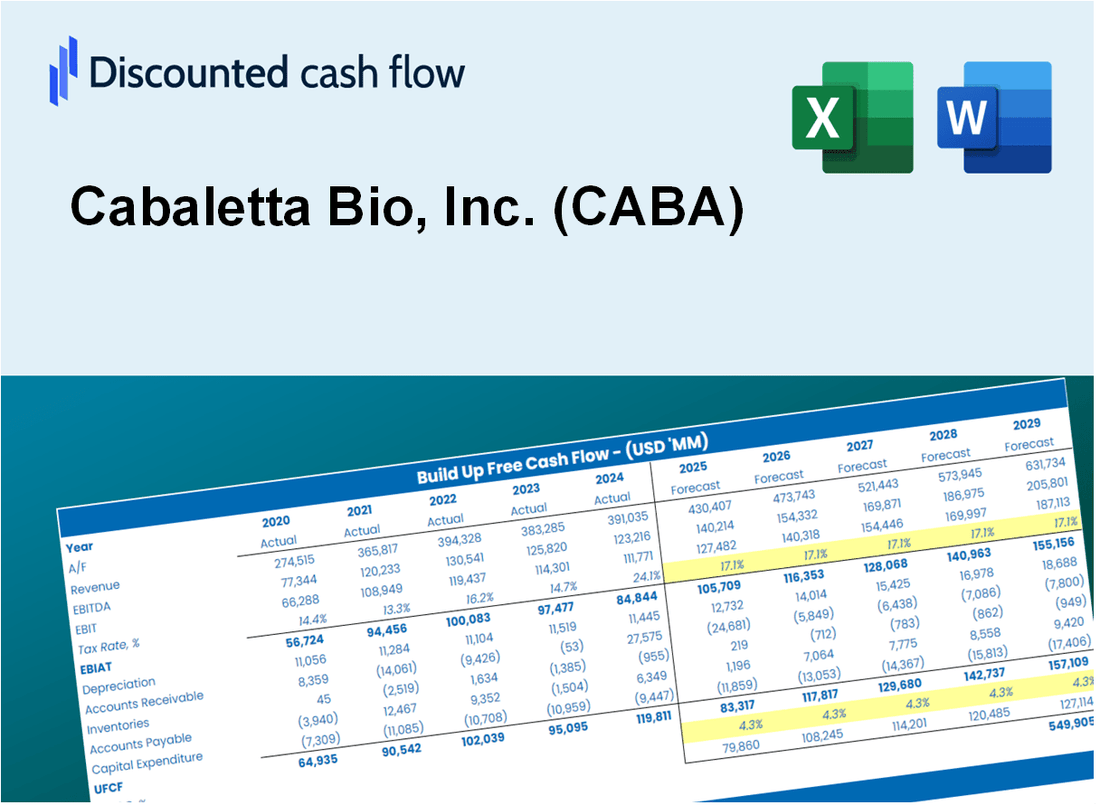
Cabaletta Bio, Inc. (CABA) Avaliação DCF |
Totalmente Editável: Adapte-Se Às Suas Necessidades No Excel Ou Planilhas
Design Profissional: Modelos Confiáveis E Padrão Da Indústria
Pré-Construídos Para Uso Rápido E Eficiente
Compatível com MAC/PC, totalmente desbloqueado
Não É Necessária Experiência; Fácil De Seguir
Cabaletta Bio, Inc. (CABA) Bundle
Projetado para precisão, a nossa calculadora DCF (CABA) capacita você a avaliar a avaliação da Cabaletta Bio, Inc. usando dados financeiros do mundo real e oferece flexibilidade completa para modificar todos os parâmetros essenciais para projeções aprimoradas.
Discounted Cash Flow (DCF) - (USD MM)
| Year | AY1 2020 |
AY2 2021 |
AY3 2022 |
AY4 2023 |
AY5 2024 |
FY1 2025 |
FY2 2026 |
FY3 2027 |
FY4 2028 |
FY5 2029 |
|---|---|---|---|---|---|---|---|---|---|---|
| Revenue | .0 | .0 | .0 | .0 | .0 | .0 | .0 | .0 | .0 | .0 |
| Revenue Growth, % | 0 | 0 | 0 | 0 | 0 | 0 | 0 | 0 | 0 | 0 |
| EBITDA | -33.0 | -45.6 | -49.3 | -66.2 | -110.3 | .0 | .0 | .0 | .0 | .0 |
| EBITDA, % | 100 | 100 | 100 | 100 | 100 | 100 | 100 | 100 | 100 | 100 |
| Depreciation | .4 | .7 | 3.7 | 1.4 | 4.8 | .0 | .0 | .0 | .0 | .0 |
| Depreciation, % | 100 | 100 | 100 | 100 | 100 | 100 | 100 | 100 | 100 | 100 |
| EBIT | -33.3 | -46.3 | -53.0 | -67.7 | -115.1 | .0 | .0 | .0 | .0 | .0 |
| EBIT, % | 100 | 100 | 100 | 100 | 100 | 100 | 100 | 100 | 100 | 100 |
| Total Cash | 108.7 | 122.2 | 106.5 | 241.2 | 164.0 | .0 | .0 | .0 | .0 | .0 |
| Total Cash, percent | .0 | .0 | .0 | .0 | .0 | .0 | .0 | .0 | .0 | .0 |
| Account Receivables | .0 | .0 | .0 | .0 | .0 | .0 | .0 | .0 | .0 | .0 |
| Account Receivables, % | 100 | 100 | 100 | 100 | 100 | 100 | 100 | 100 | 100 | 100 |
| Inventories | .0 | .0 | .0 | .0 | .0 | .0 | .0 | .0 | .0 | .0 |
| Inventories, % | 100 | 100 | 100 | 100 | 100 | 100 | 100 | 100 | 100 | 100 |
| Accounts Payable | 1.2 | 2.3 | 2.5 | 4.5 | 4.9 | .0 | .0 | .0 | .0 | .0 |
| Accounts Payable, % | 100 | 100 | 100 | 100 | 100 | 100 | 100 | 100 | 100 | 100 |
| Capital Expenditure | -.6 | -1.2 | -2.5 | -.7 | -2.2 | .0 | .0 | .0 | .0 | .0 |
| Capital Expenditure, % | 100 | 100 | 100 | 100 | 100 | 0 | 0 | 0 | 0 | 0 |
| Tax Rate, % | 0 | 0 | 0 | 0 | 0 | 0 | 0 | 0 | 0 | 0 |
| EBITAT | -33.3 | -46.3 | -53.0 | -67.7 | -115.1 | .0 | .0 | .0 | .0 | .0 |
| Depreciation | ||||||||||
| Changes in Account Receivables | ||||||||||
| Changes in Inventories | ||||||||||
| Changes in Accounts Payable | ||||||||||
| Capital Expenditure | ||||||||||
| UFCF | -32.4 | -45.6 | -51.6 | -64.9 | -112.1 | -4.9 | .0 | .0 | .0 | .0 |
| WACC, % | 16.91 | 16.91 | 16.91 | 16.91 | 16.91 | 16.91 | 16.91 | 16.91 | 16.91 | 16.91 |
| PV UFCF | ||||||||||
| SUM PV UFCF | -4.2 | |||||||||
| Long Term Growth Rate, % | 2.00 | |||||||||
| Free cash flow (T + 1) | 0 | |||||||||
| Terminal Value | 0 | |||||||||
| Present Terminal Value | 0 | |||||||||
| Enterprise Value | -4 | |||||||||
| Net Debt | -148 | |||||||||
| Equity Value | 144 | |||||||||
| Diluted Shares Outstanding, MM | 49 | |||||||||
| Equity Value Per Share | 2.91 |
What You Will Get
- Editable Excel Template: A fully customizable Excel-based DCF Calculator featuring pre-filled real CABA financials.
- Real-World Data: Historical data and forward-looking estimates (as indicated in the yellow cells).
- Forecast Flexibility: Adjust forecast assumptions such as revenue growth, EBITDA %, and WACC.
- Automatic Calculations: Instantly observe the impact of your inputs on Cabaletta Bio’s valuation.
- Professional Tool: Designed for investors, CFOs, consultants, and financial analysts.
- User-Friendly Design: Organized for clarity and ease of use, complete with step-by-step instructions.
Key Features
- 🔍 Real-Life CABA Financials: Pre-filled historical and projected data for Cabaletta Bio, Inc. (CABA).
- ✏️ Fully Customizable Inputs: Adjust all critical parameters (yellow cells) like WACC, growth %, and tax rates.
- 📊 Professional DCF Valuation: Built-in formulas calculate Cabaletta Bio’s intrinsic value using the Discounted Cash Flow method.
- ⚡ Instant Results: Visualize Cabaletta Bio’s valuation instantly after making changes.
- Scenario Analysis: Test and compare outcomes for various financial assumptions side-by-side.
How It Works
- Download: Obtain the comprehensive Excel file containing Cabaletta Bio, Inc. (CABA) financial data.
- Customize: Modify projections, such as revenue growth, EBITDA %, and WACC to fit your analysis.
- Update Automatically: The intrinsic value and NPV calculations refresh in real-time as you make changes.
- Test Scenarios: Generate various projections and evaluate results instantly for better insights.
- Make Decisions: Leverage the valuation outcomes to inform your investment decisions with Cabaletta Bio, Inc. (CABA).
Why Choose This Calculator for Cabaletta Bio, Inc. (CABA)?
- Comprehensive Tool: Integrates DCF, WACC, and financial ratio analyses tailored for Cabaletta Bio.
- Customizable Inputs: Modify yellow-highlighted cells to explore different financial scenarios for (CABA).
- Detailed Insights: Automatically computes Cabaletta Bio’s intrinsic value and Net Present Value.
- Preloaded Data: Historical and forecasted data provide a reliable foundation for analysis.
- Professional Quality: Perfect for financial analysts, investors, and consultants focused on (CABA).
Who Should Use Cabaletta Bio, Inc. (CABA)?
- Investors: Gain insights into innovative therapies with a focus on cell-based treatments.
- Biotech Analysts: Utilize comprehensive data and research to enhance your market evaluations.
- Healthcare Consultants: Tailor presentations and reports with the latest developments in gene therapy.
- Life Sciences Enthusiasts: Expand your knowledge of cutting-edge biotechnological advancements.
- Educators and Students: Leverage real-life case studies in biotechnology for academic purposes.
What the Template Contains
- Historical Data: Includes Cabaletta Bio’s past financials and baseline forecasts.
- DCF and Levered DCF Models: Detailed templates to calculate Cabaletta Bio’s intrinsic value.
- WACC Sheet: Pre-built calculations for Weighted Average Cost of Capital.
- Editable Inputs: Modify key drivers like growth rates, EBITDA %, and CAPEX assumptions.
- Quarterly and Annual Statements: A complete breakdown of Cabaletta Bio’s financials.
- Interactive Dashboard: Visualize valuation results and projections dynamically.
Disclaimer
All information, articles, and product details provided on this website are for general informational and educational purposes only. We do not claim any ownership over, nor do we intend to infringe upon, any trademarks, copyrights, logos, brand names, or other intellectual property mentioned or depicted on this site. Such intellectual property remains the property of its respective owners, and any references here are made solely for identification or informational purposes, without implying any affiliation, endorsement, or partnership.
We make no representations or warranties, express or implied, regarding the accuracy, completeness, or suitability of any content or products presented. Nothing on this website should be construed as legal, tax, investment, financial, medical, or other professional advice. In addition, no part of this site—including articles or product references—constitutes a solicitation, recommendation, endorsement, advertisement, or offer to buy or sell any securities, franchises, or other financial instruments, particularly in jurisdictions where such activity would be unlawful.
All content is of a general nature and may not address the specific circumstances of any individual or entity. It is not a substitute for professional advice or services. Any actions you take based on the information provided here are strictly at your own risk. You accept full responsibility for any decisions or outcomes arising from your use of this website and agree to release us from any liability in connection with your use of, or reliance upon, the content or products found herein.