
|
CF Bankshares Inc. (CFBK) Avaliação DCF |
Totalmente Editável: Adapte-Se Às Suas Necessidades No Excel Ou Planilhas
Design Profissional: Modelos Confiáveis E Padrão Da Indústria
Pré-Construídos Para Uso Rápido E Eficiente
Compatível com MAC/PC, totalmente desbloqueado
Não É Necessária Experiência; Fácil De Seguir
CF Bankshares Inc. (CFBK) Bundle
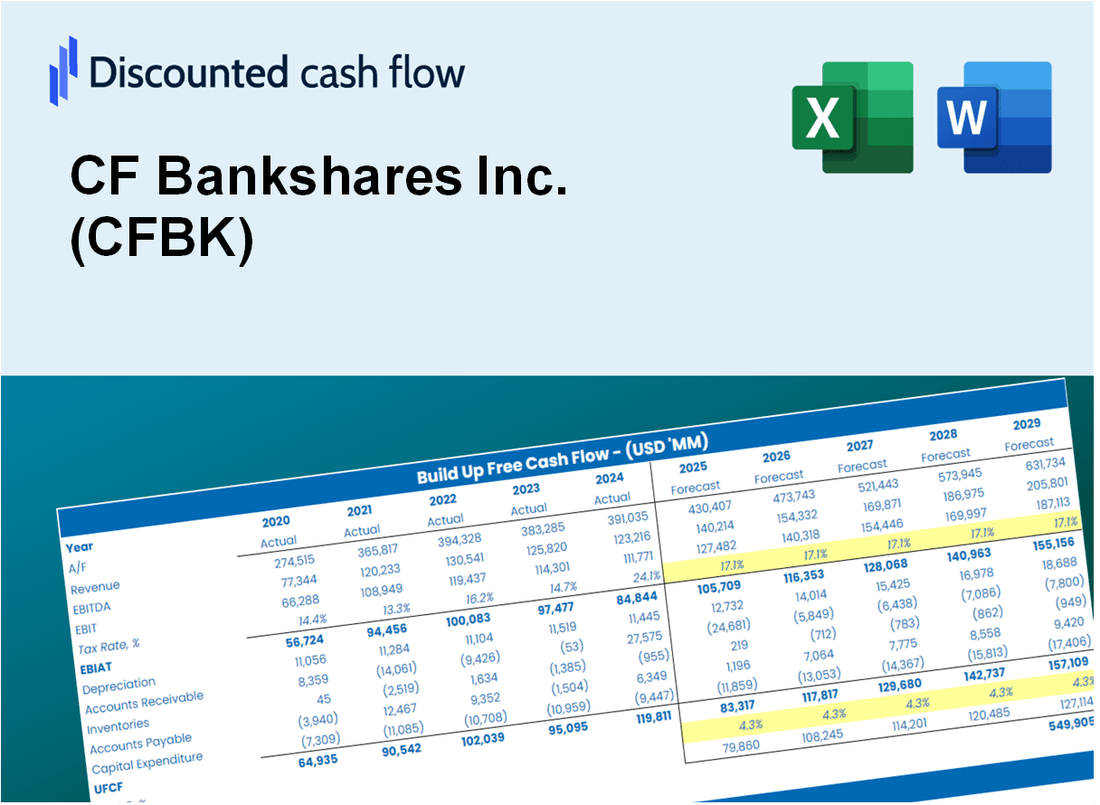
Como investidor ou analista, esta calculadora DCF [símbolo] é o seu recurso preferido para uma avaliação precisa. Carregado com dados reais da CF Bankshares Inc., você pode ajustar as previsões e observar instantaneamente os efeitos.
Discounted Cash Flow (DCF) - (USD MM)
| Year | AY1 2020 |
AY2 2021 |
AY3 2022 |
AY4 2023 |
AY5 2024 |
FY1 2025 |
FY2 2026 |
FY3 2027 |
FY4 2028 |
FY5 2029 |
|---|---|---|---|---|---|---|---|---|---|---|
| Revenue | 102.1 | 63.6 | 70.3 | 111.7 | 122.2 | 134.7 | 148.5 | 163.8 | 180.6 | 199.2 |
| Revenue Growth, % | 0 | -37.66 | 10.44 | 58.92 | 9.38 | 10.27 | 10.27 | 10.27 | 10.27 | 10.27 |
| EBITDA | 36.7 | 23.3 | 23.1 | 21.6 | 16.6 | 37.2 | 41.1 | 45.3 | 49.9 | 55.1 |
| EBITDA, % | 35.92 | 36.54 | 32.85 | 19.3 | 13.61 | 27.64 | 27.64 | 27.64 | 27.64 | 27.64 |
| Depreciation | .4 | .4 | .5 | .6 | .5 | .7 | .8 | .9 | 1.0 | 1.1 |
| Depreciation, % | 0.37325 | 0.68358 | 0.70575 | 0.50765 | 0.39783 | 0.53361 | 0.53361 | 0.53361 | 0.53361 | 0.53361 |
| EBIT | 36.3 | 22.8 | 22.6 | 21.0 | 16.1 | 36.5 | 40.3 | 44.4 | 49.0 | 54.0 |
| EBIT, % | 35.55 | 35.86 | 32.15 | 18.79 | 13.22 | 27.11 | 27.11 | 27.11 | 27.11 | 27.11 |
| Total Cash | 230.4 | 183.0 | 162.3 | 269.8 | 244.1 | 134.7 | 148.5 | 163.8 | 180.6 | 199.2 |
| Total Cash, percent | .0 | .0 | .0 | .0 | .0 | .0 | .0 | .0 | .0 | .0 |
| Account Receivables | 34.6 | 24.6 | 20.8 | 13.5 | 7.7 | 32.5 | 35.8 | 39.5 | 43.5 | 48.0 |
| Account Receivables, % | 33.93 | 38.6 | 29.55 | 12.08 | 6.29 | 24.09 | 24.09 | 24.09 | 24.09 | 24.09 |
| Inventories | .0 | .0 | .0 | .0 | .0 | .0 | .0 | .0 | .0 | .0 |
| Inventories, % | 0 | 0 | 0 | 0 | 0 | 0 | 0 | 0 | 0 | 0 |
| Accounts Payable | 21.9 | 14.5 | 23.7 | .0 | .0 | 21.0 | 23.2 | 25.5 | 28.2 | 31.0 |
| Accounts Payable, % | 21.44 | 22.81 | 33.68 | 0 | 0 | 15.58 | 15.58 | 15.58 | 15.58 | 15.58 |
| Capital Expenditure | -.4 | -3.0 | -.9 | -.7 | -.3 | -1.9 | -2.1 | -2.3 | -2.6 | -2.8 |
| Capital Expenditure, % | -0.37717 | -4.65 | -1.29 | -0.59181 | -0.21774 | -1.43 | -1.43 | -1.43 | -1.43 | -1.43 |
| Tax Rate, % | 17.08 | 17.08 | 17.08 | 17.08 | 17.08 | 17.08 | 17.08 | 17.08 | 17.08 | 17.08 |
| EBITAT | 29.6 | 18.5 | 18.2 | 16.9 | 13.4 | 29.7 | 32.7 | 36.1 | 39.8 | 43.9 |
| Depreciation | ||||||||||
| Changes in Account Receivables | ||||||||||
| Changes in Inventories | ||||||||||
| Changes in Accounts Payable | ||||||||||
| Capital Expenditure | ||||||||||
| UFCF | 16.9 | 18.6 | 30.7 | .4 | 19.4 | 24.7 | 30.2 | 33.3 | 36.8 | 40.5 |
| WACC, % | 26.08 | 25.88 | 25.75 | 25.84 | 26.45 | 26 | 26 | 26 | 26 | 26 |
| PV UFCF | ||||||||||
| SUM PV UFCF | 82.7 | |||||||||
| Long Term Growth Rate, % | 2.00 | |||||||||
| Free cash flow (T + 1) | 41 | |||||||||
| Terminal Value | 172 | |||||||||
| Present Terminal Value | 54 | |||||||||
| Enterprise Value | 137 | |||||||||
| Net Debt | -121 | |||||||||
| Equity Value | 258 | |||||||||
| Diluted Shares Outstanding, MM | 6 | |||||||||
| Equity Value Per Share | 40.96 |
What You Will Get
- Editable Forecast Inputs: Easily adjust key assumptions (growth %, margins, WACC) to explore various scenarios.
- Real-World Data: CF Bankshares Inc.’s (CFBK) financial information pre-filled to streamline your analysis.
- Automatic DCF Outputs: The template computes Net Present Value (NPV) and intrinsic value automatically.
- Customizable and Professional: A refined Excel model tailored to meet your valuation requirements.
- Built for Analysts and Investors: Perfect for evaluating projections, confirming strategies, and enhancing efficiency.
Key Features
- Customizable Financial Parameters: Adjust essential inputs such as loan growth, interest rates, and operational expenses.
- Instant DCF Valuation: Quickly computes intrinsic value, NPV, and additional metrics with ease.
- High-Precision Accuracy: Leverages CF Bankshares Inc.'s (CFBK) real financial data for credible valuation results.
- Effortless Scenario Testing: Evaluate various assumptions and analyze results without hassle.
- Efficiency Booster: Avoid the complexity of creating intricate valuation models from the ground up.
How It Works
- Step 1: Download the prebuilt Excel template featuring CF Bankshares Inc. (CFBK) data.
- Step 2: Navigate through the pre-filled sheets to familiarize yourself with the essential metrics.
- Step 3: Modify forecasts and assumptions in the editable yellow cells (WACC, growth, margins).
- Step 4: Instantly see recalculated results, including CF Bankshares Inc.'s (CFBK) intrinsic value.
- Step 5: Make well-informed investment decisions or create reports based on the outputs.
Why Choose This Calculator for CF Bankshares Inc. (CFBK)?
- Comprehensive Tool: Combines DCF, WACC, and financial ratio analyses tailored for CF Bankshares Inc. (CFBK).
- Customizable Inputs: Modify yellow-highlighted cells to explore different financial scenarios for CF Bankshares Inc. (CFBK).
- Detailed Insights: Automatically computes CF Bankshares Inc. (CFBK)'s intrinsic value and Net Present Value.
- Preloaded Data: Historical and projected data provide a solid foundation for analysis of CF Bankshares Inc. (CFBK).
- Professional Quality: Perfect for financial analysts, investors, and business consultants focusing on CF Bankshares Inc. (CFBK).
Who Should Use This Product?
- Investors: Evaluate CF Bankshares Inc. (CFBK) to inform your investment decisions.
- CFOs and Financial Analysts: Optimize valuation methodologies and assess financial forecasts.
- Startup Founders: Understand the valuation practices of established financial institutions like CF Bankshares Inc. (CFBK).
- Consultants: Provide detailed valuation assessments and reports for your clients.
- Students and Educators: Utilize real-time data to learn and teach financial valuation strategies.
What the Template Contains
- Preloaded CFBK Data: Historical and projected financial data, including revenue, EBIT, and capital expenditures.
- DCF and WACC Models: Professional-grade sheets for calculating intrinsic value and Weighted Average Cost of Capital.
- Editable Inputs: Yellow-highlighted cells for adjusting revenue growth, tax rates, and discount rates.
- Financial Statements: Comprehensive annual and quarterly financials for deeper analysis.
- Key Ratios: Profitability, leverage, and efficiency ratios to evaluate performance.
- Dashboard and Charts: Visual summaries of valuation outcomes and assumptions.
Disclaimer
All information, articles, and product details provided on this website are for general informational and educational purposes only. We do not claim any ownership over, nor do we intend to infringe upon, any trademarks, copyrights, logos, brand names, or other intellectual property mentioned or depicted on this site. Such intellectual property remains the property of its respective owners, and any references here are made solely for identification or informational purposes, without implying any affiliation, endorsement, or partnership.
We make no representations or warranties, express or implied, regarding the accuracy, completeness, or suitability of any content or products presented. Nothing on this website should be construed as legal, tax, investment, financial, medical, or other professional advice. In addition, no part of this site—including articles or product references—constitutes a solicitation, recommendation, endorsement, advertisement, or offer to buy or sell any securities, franchises, or other financial instruments, particularly in jurisdictions where such activity would be unlawful.
All content is of a general nature and may not address the specific circumstances of any individual or entity. It is not a substitute for professional advice or services. Any actions you take based on the information provided here are strictly at your own risk. You accept full responsibility for any decisions or outcomes arising from your use of this website and agree to release us from any liability in connection with your use of, or reliance upon, the content or products found herein.