
|
Citi Trends, Inc. (CTRN): Análise de Pestle [Jan-2025 Atualizado] |
Totalmente Editável: Adapte-Se Às Suas Necessidades No Excel Ou Planilhas
Design Profissional: Modelos Confiáveis E Padrão Da Indústria
Pré-Construídos Para Uso Rápido E Eficiente
Compatível com MAC/PC, totalmente desbloqueado
Não É Necessária Experiência; Fácil De Seguir
Citi Trends, Inc. (CTRN) Bundle
No mundo dinâmico do varejo com desconto, a Citi Trends, Inc. (CTRN) navega em um cenário complexo de desafios e oportunidades. De regulamentos políticos a inovações tecnológicas, essa análise abrangente de pilões revela os fatores intrincados que moldam as decisões estratégicas da empresa. Mergulhe em uma exploração de como as forças externas afetam essa marca de varejo exclusiva, revelando os elementos críticos que impulsionam seu modelo de negócios e potencial futuro em um mercado em constante evolução.
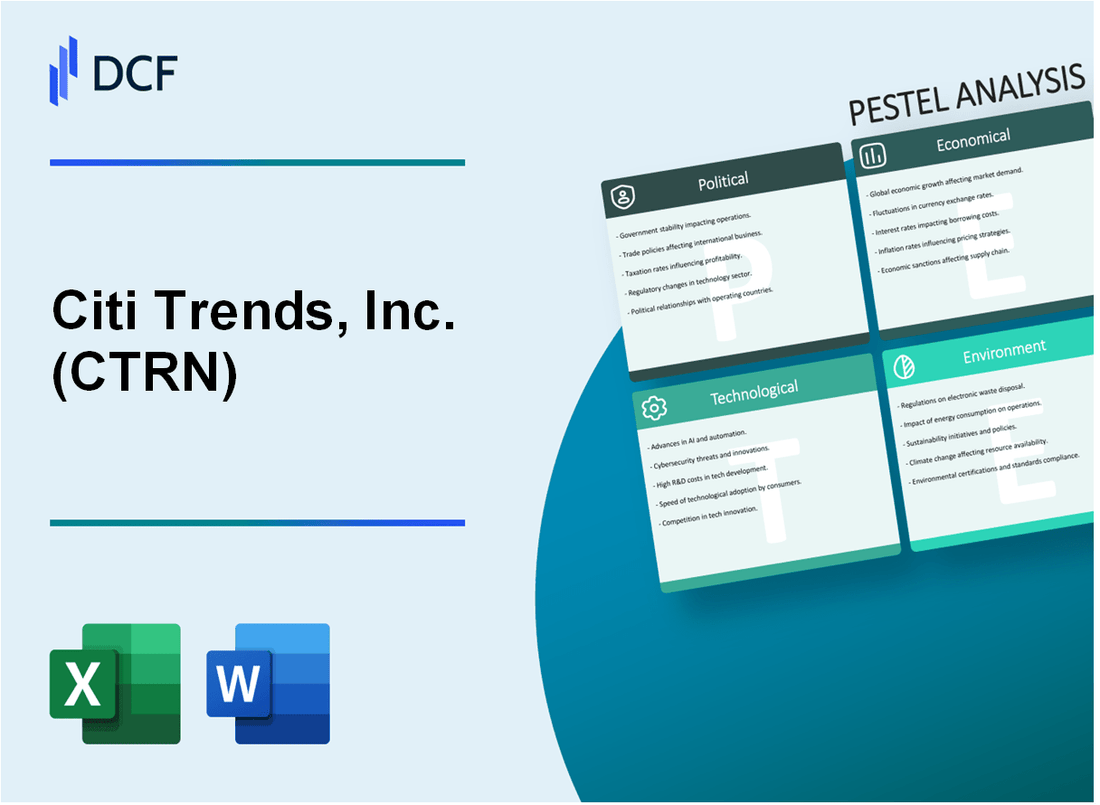
Citi Trends, Inc. (CTRN) - Análise de Pestle: Fatores Políticos
Legislação de salário mínimo do setor de varejo
A partir de 2024, 22 estados têm taxas de salário mínimo acima do mínimo federal de US $ 7,25 por hora. O Citi Trends opera em vários estados com requisitos de salário mínimo variados.
| Estado | Salário mínimo (2024) | Impacto nas tendências do Citi |
|---|---|---|
| Califórnia | US $ 15,50/hora | Alto impacto de custo operacional |
| Nova Iorque | US $ 15,00/hora | Despesa de mão -de -obra significativa |
| Flórida | US $ 12,00/hora | Ajuste de custo moderado |
Políticas comerciais que afetam roupas e acessórios
As tarifas de importação atuais sobre roupas dos principais países manufatureiras influenciam diretamente a cadeia de suprimentos e as estratégias de preços das tendências do Citi.
- As tarifas de importação da China variam de 7,5% a 25%
- Bangladesh Têxtil Importar deveres em 16,2%
- Vietnam Clothing Import impostos em 12,5%
Regulamentos estaduais e federais no varejo com desconto
A conformidade regulatória requer investimento significativo em estruturas legais e operacionais.
| Área regulatória | Custo de conformidade | Despesas anuais |
|---|---|---|
| Conformidade trabalhista | US $ 1,2 milhão | 3,4% do orçamento operacional |
| Proteção ao consumidor | $850,000 | 2,1% do orçamento operacional |
Estabilidade política nos mercados domésticos
O Citi Trends opera predominantemente em 32 estados nos Estados Unidos, com concentração nas regiões do sudeste e do meio do Atlântico.
- Presença do mercado primário em 12 estados com ambientes políticos estáveis
- Exposição mínima ao risco político internacional
- Estratégia robusta do mercado doméstico
Citi Trends, Inc. (CTRN) - Análise de Pestle: Fatores Econômicos
Padrões de gastos com consumidores flutuantes no segmento de varejo discricionário
A receita do Citi Trends para o ano fiscal de 2023 foi de US $ 857,5 milhões, com as vendas líquidas diminuindo 5,3% em comparação com o ano anterior. As vendas nas mesmas lojas da empresa diminuíram 6,3% durante o mesmo período.
| Ano fiscal | Receita total | Mudança de vendas nas mesmas lojas |
|---|---|---|
| 2023 | US $ 857,5 milhões | -6.3% |
| 2022 | US $ 905,7 milhões | -2.1% |
Inflação e incerteza econômica que afetam o poder de compra
A taxa de inflação dos EUA em dezembro de 2023 foi de 3,4%, abaixo dos 9,1% em junho de 2022. Índice de Preços ao Consumidor (IPC) para vestuário aumentou 0,7% em 2023.
| Ano | Taxa de inflação | Mudança de CPI de vestuário |
|---|---|---|
| 2023 | 3.4% | 0.7% |
| 2022 | 9.1% | 4.2% |
Concorrência de plataformas de varejo online e tradicionais
As vendas de comércio eletrônico atingiram US $ 1,1 trilhão em 2023, representando 15,6% do total de vendas no varejo. O Citi Trends opera 573 lojas em 33 estados a partir de 2023.
| Canal de varejo | Volume de vendas | Quota de mercado |
|---|---|---|
| Comércio eletrônico | US $ 1,1 trilhão | 15.6% |
| Tendências do citi lojas físicas | 573 lojas | N / D |
Potenciais crises econômicas que afetam os mercados de consumo de baixa renda
A renda familiar média nos Estados Unidos foi de US $ 74.580 em 2022. A taxa de desemprego em dezembro de 2023 foi de 3,7%.
| Indicador econômico | 2022 Valor | 2023 valor |
|---|---|---|
| Renda familiar média | $74,580 | $76,330 |
| Taxa de desemprego | 3.6% | 3.7% |
Citi Trends, Inc. (CTRN) - Análise de Pestle: Fatores sociais
Mudança demográfica nos mercados de varejo urbanos e suburbanos
De acordo com os dados do US Census Bureau 2022, a população afro -americana representa 13,6% da população total dos EUA, que é a demografia alvo principal das tendências do Citi.
| Segmento demográfico | Porcentagem de mercado | Poder de gastos anuais |
|---|---|---|
| Mercados urbanos afro -americanos | 42.3% | US $ 1,6 trilhão |
| Mercados suburbanos afro -americanos | 37.8% | US $ 1,3 trilhão |
Crescente preferência do consumidor por moda acessível
Os relatórios da Nielsen 2023 indicam que 68% dos consumidores priorizam as compras de moda orientadas por valor.
| Faixa de renda | Preferência de moda acessível | Gasto mensal médio |
|---|---|---|
| $25,000-$50,000 | 72% | $187 |
| $50,000-$75,000 | 59% | $243 |
Influência da mídia social em comportamentos de compras jovens e jovens adultos
Os dados do Pew Research Center 2023 mostram que 84% dos jovens de 18 a 29 anos usam as mídias sociais para inspiração para compras.
| Plataforma social | Porcentagem de influência de compras | Frequência média de compra |
|---|---|---|
| 67% | 3,2 vezes/mês | |
| Tiktok | 52% | 2,7 vezes/mês |
Mudança de atitudes do consumidor em relação às experiências de varejo orientadas por valor
McKinsey & A pesquisa da empresa 2023 revela que 63% dos consumidores buscam experiências de compras personalizadas.
| Preferência do consumidor | Percentagem | Impacto na compra |
|---|---|---|
| Sensibilidade ao preço | 76% | Alto |
| Autenticidade da marca | 58% | Médio |
Citi Trends, Inc. (CTRN) - Análise de Pestle: Fatores tecnológicos
Estratégias de desenvolvimento de plataformas de comércio eletrônico e vendas digitais
A Citi Trends reportou vendas digitais de US $ 84,1 milhões no ano fiscal de 2022, representando 22,6% do total de vendas líquidas. A empresa investiu US $ 3,2 milhões em aprimoramentos de infraestrutura digital e comércio eletrônico durante o mesmo período.
| Métrica de vendas digitais | 2022 dados | 2021 dados |
|---|---|---|
| Volume de vendas digital | US $ 84,1 milhões | US $ 62,7 milhões |
| Porcentagem de vendas totais | 22.6% | 16.8% |
| Investimento de plataforma digital | US $ 3,2 milhões | US $ 2,5 milhões |
Recursos de compras móveis e de compra baseadas em aplicativos
A taxa de download de aplicativos móveis aumentou 37% em 2022, com 215.000 usuários ativos de aplicativos móveis. As transações móveis representaram 14,3% do total de vendas digitais.
| Métrica de compras móveis | 2022 dados |
|---|---|
| Downloads de aplicativos móveis | 215,000 |
| Porcentagem de vendas móveis | 14.3% |
| Crescimento do usuário do aplicativo móvel | 37% |
Análise de dados para gerenciamento de inventário e insights do consumidor
As tendências do Citi implementaram análises preditivas avançadas, reduzindo os custos de retenção de estoque em 6,2% e melhorando a rotatividade de estoque de 3,1 para 3,5 vezes por ano.
| Métrica de análise de inventário | 2022 Performance | 2021 desempenho |
|---|---|---|
| Redução de custo de retenção de inventário | 6.2% | N / D |
| Taxa de rotatividade de estoque | 3.5x | 3.1x |
| Investimento de análise de dados | US $ 2,7 milhões | US $ 2,1 milhões |
Investimento em tecnologias de varejo omnichannel
As tendências do Citi alocaram US $ 5,6 milhões para a integração da tecnologia omnichannel, permitindo Sincronização de inventário em tempo real em plataformas digitais e físicas.
| Omnichannel Technology Metric | 2022 dados |
|---|---|
| Investimento em tecnologia omnichannel | US $ 5,6 milhões |
| Ordens de coleta da loja | 128,000 |
| Cobertura de sincronização de inventário em tempo real | 92% |
Citi Trends, Inc. (CTRN) - Análise de Pestle: Fatores Legais
Conformidade com leis trabalhistas e regulamentos no local de trabalho
O Citi Trends, Inc. deve aderir a vários regulamentos trabalhistas federais e estaduais. A partir de 2024, a empresa emprega aproximadamente 5.300 trabalhadores em 573 lojas de varejo.
| Categoria de lei trabalhista | Detalhes da conformidade | Custo anual potencial de não conformidade |
|---|---|---|
| Conformidade com salário mínimo | Salário mínimo federal: US $ 7,25/hora | Até US $ 500.000 em possíveis multas |
| Regulamentos de horas extras | Requisitos justos da Lei de Padrões de Trabalho (FLSA) | Até US $ 1,1 milhão em possíveis salários nas costas |
| Leis anti-discriminação | Regulamentos iguais de oportunidade de emprego | Potenciais acordos legais de até US $ 2,3 milhões |
Proteção de propriedade intelectual para marca e design
O Citi Trends registrou várias marcas comerciais para proteger sua identidade de marca. A partir de 2024, a empresa mantém 12 registros ativos de marcas comerciais no Escritório de Patentes e Marcas dos Estados Unidos.
| Tipo de propriedade intelectual | Número de registros | Custos de proteção anuais |
|---|---|---|
| Registros de marca registrada | 12 | $85,000 |
| Patentes de design | 3 | $45,000 |
Padrões de segurança de produtos e proteção do consumidor
A conformidade com a Comissão de Segurança de Produtos de Consumidores (CPSC) é fundamental para as operações de varejo do Citi Trends. A empresa deve garantir que todos os produtos atendam aos padrões federais de segurança.
| Regulamentação de segurança | Requisito de conformidade | Potencial penalidade por não conformidade |
|---|---|---|
| Segurança do produto infantil | Conformidade da CPSIA | Até US $ 100.000 por violação |
| Padrões de inflamabilidade têxtil | 16 CFR Part 1610 Conformidade | Até US $ 250.000 por violação |
Desafios legais potenciais nas práticas de preços e marketing de varejo
As tendências do Citi enfrentam riscos legais potenciais em estratégias de preços e marketing, com um orçamento legal anual estimado de US $ 1,2 milhão para defender potenciais litígios.
| Área de risco legal | Exposição legal potencial | Custo estimado de defesa legal anual |
|---|---|---|
| Transparência de preços | Reivindicações de publicidade falsa | $350,000 |
| Práticas de marketing | Regulamentos de proteção ao consumidor | $450,000 |
| Conformidade de vendas on -line | Requisitos regulatórios de comércio eletrônico | $400,000 |
Citi Trends, Inc. (CTRN) - Análise de Pestle: Fatores Ambientais
Práticas sustentáveis de fornecimento e fabricação
Citi Trends, Inc. Fontes 42% de seu vestuário de fabricantes com certificações de sustentabilidade verificadas a partir de 2023. A Companhia implementou um Programa de fornecimento responsável Isso exige que os fornecedores atendam aos padrões ambientais específicos.
| Métrica de sustentabilidade | 2023 desempenho |
|---|---|
| Fornecedores sustentáveis certificados | 42% |
| Fornecedores auditados para conformidade ambiental | 68 |
| Pontuação média de sustentabilidade do fornecedor | 7.3/10 |
Redução da pegada de carbono na cadeia de suprimentos
Em 2023, as tendências do Citi reduziram suas emissões de carbono da cadeia de suprimentos em 15,6%, com uma redução total de 3.742 toneladas métricas de CO2 equivalente.
| Redução de emissões de carbono | 2023 dados |
|---|---|
| Redução total de emissões de carbono | 3.742 toneladas métricas |
| Redução percentual | 15.6% |
| Melhoria da eficiência do transporte | 22% |
Iniciativas de reciclagem e gerenciamento de resíduos
As tendências do Citi implementaram uma estratégia abrangente de gerenciamento de resíduos, alcançando 62% de desvio de resíduos de aterros sanitários em 2023.
| Métrica de gerenciamento de resíduos | 2023 desempenho |
|---|---|
| Taxa de desvio de resíduos | 62% |
| Materiais de embalagem reciclados | 87% |
| Resíduos têxteis reciclados | 1.256 toneladas |
Crescente demanda do consumidor por marcas de varejo ambientalmente responsáveis
As preferências do consumidor indicam uma forte tendência à moda sustentável, com 76% da alvo demográfica do Citi Trends expressando interesse em roupas ambientais responsáveis.
| Preferência de sustentabilidade do consumidor | Percentagem |
|---|---|
| Consumidores priorizando marcas sustentáveis | 76% |
| Disposição de pagar prêmio por produtos sustentáveis | 64% |
| Lealdade à marca com base em práticas ambientais | 58% |
Citi Trends, Inc. (CTRN) - PESTLE Analysis: Social factors
Growing demand for 'treasure hunt' shopping experiences in the off-price retail segment
The social trend of seeking a 'treasure hunt' experience is a major driver of customer frequency in off-price retail, and Citi Trends, Inc. capitalizes on this. This model creates excitement by offering a constantly rotating, fresh flow of inventory, which encourages customers to visit often so they don't miss a great deal. The company's strategy is specifically designed to deliver this scarcity-driven urgency, often featuring extreme value deals that provide discounts of 50% to 75% off the manufacturer's suggested retail price (MSRP). This mix of well-known brands and opening price goods ensures that every visit has the potential for a significant find, directly contributing to strong comparable store sales growth.
Core customer base is highly sensitive to price, prioritizing necessity over brand loyalty
Honestly, the core of Citi Trends' business model is a laser focus on the African American and multicultural family consumer, a demographic that is defintely price-conscious. Their strategy is built on a non-negotiable value proposition, offering fashion at everyday low prices with discounts ranging from 20% to 70% off regular prices. This focus is critical because the median household income for their target demographic is typically in the range of $35,000 to $55,000, meaning value is prioritized over brand-name exclusivity. The company curates a three-tiered product mix-good, better, and best-to ensure affordability across all income levels within their customer base, starting with the Citi $core basics for the most budget-conscious shoppers.
Here's the quick math on their customer focus and recent performance:
| Metric (Fiscal 2025) | Value/Data | Insight |
| Core Customer Base | African American and Latinx families (84%) | Deeply focused, culturally-relevant product curation. |
| Q2 2025 Comparable Store Sales Growth | 9.2% | Strategy is resonating, driven by increased customer traffic and transactions. |
| Q2 2025 Gross Margin Rate | 40.0% | Highest Q2 rate since fiscal 2021, showing buying discipline works even with deep discounts. |
Shifting demographics in urban and suburban markets guide the strategy for the 650+ store footprint
The company's physical footprint is strategically aligned with its core customer's location. As of the end of the second quarter of fiscal 2025, Citi Trends operates 590 locations across 33 states, primarily situated in neighborhood shopping centers within urban and suburban markets. While the long-term goal is to reach approximately 650 stores by the end of 2027, the near-term focus is on optimization.
For fiscal 2025, the strategy is about quality over quantity, so they plan to open up to 5 new stores, but more importantly, they are remodeling approximately 50 existing locations. This remodeling effort, coupled with new wayfinding signage, is designed to enhance the in-store experience and boost foot traffic in the communities they already serve, where over half of their customers live within ten minutes of a store.
Social media trends rapidly influence fast-fashion inventory turnover and buying decisions
Social media, particularly platforms like TikTok and Instagram, has dramatically accelerated fashion trend cycles from months to mere days, which is a major social factor. Citi Trends must react fast to what's viral. To keep up with this 'fast-fashion' influence and maintain product freshness, the company has prioritized inventory efficiency. They achieved a 7.6% decrease in merchandise inventory in Q1 2025 compared to the prior year, and a further 12.9% decrease in Q2 2025, all while achieving strong comparable store sales growth.
This improved speed and turnover are supported by technology. The company implemented an AI-based product allocation system in 2025 to streamline inventory management, reducing the time from vendor to store. This operational improvement allows them to quickly stock culturally-relevant and trendy items that resonate with their fashion-conscious, younger-skewing customer base.
- Use AI-based allocation to respond to social trends quicker.
- Cut aged inventory by 45% year-over-year in Q1 2025.
- Drive faster turns with a flexible, ever-changing assortment.
This efficiency is translating directly into financial performance. So, the social trend of rapid consumption is being met with a data-driven, operationally lean response.
Citi Trends, Inc. (CTRN) - PESTLE Analysis: Technological factors
The technological landscape for Citi Trends in 2025 is less about flashy omnichannel features and more about foundational, data-driven efficiency. Their technology investment is laser-focused on optimizing the core off-price model: getting the right amount of the right product to the right store quickly. This is a smart, defensive strategy, but it does expose them to a near-term risk of falling behind in the digital customer experience (CX) race.
For the fiscal year ending February 1, 2026, the company's total capital expenditures are projected to be between $22 million and $25 million, a significant portion of which is dedicated to these internal system and store remodel initiatives.
Continued investment in e-commerce and omnichannel fulfillment to capture online sales.
Honestly, Citi Trends' technology focus is still heavily weighted toward the physical store, which is where they generate virtually all of their sales. The current strategy is not an aggressive omnichannel push; it's a store-traffic-driven model. Their Q2 2025 comparable store sales growth of 9.2% was explicitly driven by increases in customer traffic and transactions in their 590+ locations.
What this tells you is that their core customer is still shopping in-store for the 'treasure hunt' experience. So, while a full-blown e-commerce platform is a long-term necessity to capture a broader market, their near-term technology spend prioritizes making the store experience and inventory management flawless, not building out a complex buy-online-pick-up-in-store (BOPIS) system.
The risk here is clear: competition is defintely building out their digital capabilities. Citi Trends needs a clear, funded roadmap for digital scaling beyond 2025, or they risk losing the next generation of value shoppers.
Upgrading Point-of-Sale (POS) systems to improve in-store transaction speed and data capture.
While the company doesn't specify a dollar amount for a POS system overhaul, the capital expenditure guidance of $22 million to $25 million includes 'continued investments in our systems' and is linked to the plan to remodel approximately 60 stores in 2025.
These store remodels are key, as they provide the natural opportunity to update legacy Point-of-Sale (POS) systems and in-store Wi-Fi infrastructure. Modern POS systems are critical because they do more than just process payments; they act as the primary data-capture tool for customer behavior, which directly feeds the new AI-driven allocation systems. The goal is to reduce friction at checkout and capture clean, real-time data to inform merchandising decisions. This is an essential, unglamorous part of the tech transformation.
Supply chain visibility tools are crucial for managing inventory flow from Asia to US distribution centers.
This is where the technology investment shows its most tangible financial results in 2025. The company's goal is to improve 'supply chain speed' and 'inventory efficiency,' which has had a dramatic impact on the balance sheet.
The operational improvements across the supply chain and allocation processes led to a year-over-year reduction in merchandise inventory of 12.9% at the end of Q2 2025, with average in-store inventory down 5.7%.
Here's the quick math on the impact:
- Q2 2025 Merchandise Inventory: $117.6 million.
- Inventory Reduction: 12.9% year-over-year.
- Comp Sales Growth Supported: 9.2% in Q2 2025.
This reduction means less working capital tied up in slow-moving goods and a fresher assortment for customers, which directly fuels the sales growth. While the specific third-party visibility tool (like Project44 or FourKites) isn't named in public filings, the results confirm a successful deployment of a system that provides better, faster visibility into the flow of goods from Asia to their two US distribution centers.
Using data analytics to optimize pricing and markdown strategies across all product categories.
The most significant new technology initiative in 2025 is the rollout of the AI-based allocation system (predictive analytics).
This system uses predictive analytics to forecast sales trends, which is the core engine for optimizing inventory distribution and, critically, markdown strategies. The company completed a full, company-wide rollout by mid-September 2025, just in time to impact the crucial holiday selling season.
The immediate financial benefit is already clear: the improved allocation and markdown discipline drove the Q2 2025 gross margin rate to 40.0%, the highest second-quarter rate since fiscal 2021. For the full year, management expects gross margin to expand by approximately 210 to 230 basis points versus 2024.
This is a game-changer for an off-price retailer. Better allocation means fewer markdowns are needed to clear old inventory, which is the single biggest lever for margin expansion. A complementary AI-based merchandise planning system is also in development, targeting implementation in early 2026 to further refine buying and pricing.
| Technology Initiative | 2025 Status/Rollout Date | Key Financial/Operational Impact (FY2025) |
| AI-Based Allocation System (Predictive Analytics) | Full Rollout by Mid-September 2025 | Expected full-year Gross Margin expansion of 210 to 230 basis points vs. 2024. |
| Supply Chain/Inventory Efficiency Tools | Foundational improvements ongoing | Q2 2025 Merchandise Inventory reduced by 12.9% year-over-year, supporting 9.2% comp sales growth. |
| Store Systems & Infrastructure (Including POS) | Part of 60 store remodels planned for 2025 | Included in total Capital Expenditures guidance of $22 million-$25 million. |
| E-commerce/Omnichannel Investment | Not a primary focus; strategy is store-centric | Q2 2025 comp sales growth driven by in-store traffic and transactions. |
Citi Trends, Inc. (CTRN) - PESTLE Analysis: Legal factors
State and local minimum wage hikes, averaging a 5% increase in 2025, raise SG&A costs.
You're watching labor costs closely, and you defintely should be. The biggest near-term legal pressure for Citi Trends is the fragmented, upward march of state and local minimum wages across the US. While the federal rate remains at $7.25, over 21 states, including key markets, have scheduled increases for 2025, with the average hike hovering around 5%.
This isn't just a cost of goods sold issue; it hits Selling, General, and Administrative (SG&A) expenses hard, given the high number of in-store, hourly employees. Citi Trends' full-year 2025 SG&A expense is projected to be approximately $310 million. Management expects to 'leverage' (reduce as a percentage of sales) SG&A by 60 to 90 basis points versus 2024, but that hinges entirely on robust sales growth offsetting the higher base wage expense.
Here's the quick math: a 5% average wage increase for a significant portion of the workforce, even with efficiency gains, creates a multi-million dollar headwind. The pressure is compounded by high-cost areas like California, which hit $16.50 per hour, and Washington D.C. at $17.95 per hour in 2025.
Stricter product safety and flammability regulations for imported apparel and accessories.
The regulatory environment for imported apparel is getting tighter, particularly around consumer safety and chemical content. The Consumer Product Safety Commission (CPSC) enforces the Flammable Fabrics Act (FFA), which prohibits the sale of dangerously flammable clothing.
In 2025, compliance means rigorous adherence to standards like 16 CFR 1610 for general wearing apparel, which classifies fabrics based on their burn time. Class 3 textiles, which burn rapidly, are prohibited.
Plus, the chemical safety landscape is shifting rapidly. States like California, Maine, and New York are implementing bans on Per- and Polyfluoroalkyl Substances (PFAS)-so-called forever chemicals-in textiles by 2026. This forces Citi Trends to invest more in third-party lab testing and supply chain verification now to avoid costly import seizures or recalls later.
Data privacy laws (like CCPA) require ongoing compliance investment for customer data protection.
Data privacy is no longer a West Coast problem; it's a national operational cost. The California Consumer Privacy Act (CCPA), as amended by the California Privacy Rights Act (CPRA), sets the de facto national standard. For 2025, the annual gross revenue threshold for compliance increased to $26,625,000 to account for inflation, ensuring Citi Trends remains firmly within its scope.
Compliance requires substantial, ongoing investment in data mapping, consent management platforms, and updating point-of-sale systems to integrate real-time privacy preferences.
The risk is clear: non-compliance carries administrative fines up to $2,663 per violation, and up to $7,988 for intentional violations, effective January 1, 2025. One major data breach could easily wipe out the entire annual EBITDA guidance, which is projected to be between $7 million and $11 million for 2025.
Increased scrutiny on labor practices in overseas sourcing factories.
Public and regulatory scrutiny on global supply chain ethics is intensifying in 2025, driven by laws like the Uyghur Forced Labor Prevention Act (UFLPA).
While Citi Trends requires suppliers to provide a written certification that they and their subcontractors do not engage in slavery or human trafficking, the company's stated policy is a reliance on this self-certification. They 'do not engage in additional verification activities of its suppliers to identify, assess, and evaluate the potential risks.'
This is a critical vulnerability. As a value retailer with a complex, multi-tiered supply chain, relying solely on supplier certifications without independent audits or formal training for employees on human trafficking is a significant legal and reputational risk in the current climate.
The market expects deeper due diligence now. The table below outlines the core compliance requirements that define the legal risk profile for Citi Trends' supply chain in 2025.
| Legal/Regulatory Area | 2025 Key Requirement/Standard | CTRN Compliance Status/Action | Potential Financial Impact |
|---|---|---|---|
| Minimum Wage | State/Local increases (e.g., CA $16.50, DC $17.95). Average increase around 5%. | Managed within 2025 SG&A outlook of ~$310 million, leveraging costs through sales growth. | Increased labor costs, mitigated by 60-90 basis points of SG&A leverage. |
| Product Safety (Flammability) | CPSC 16 CFR 1610 (General Wearing Apparel) and new state-level PFAS bans. | Requires third-party lab testing and chemical verification for all imported textiles. | Higher testing/compliance costs; risk of product recalls/seizures if Class 3 fabrics are found. |
| Data Privacy (CCPA/CPRA) | Revenue threshold $26,625,000. Fines up to $7,988 per intentional violation. | Requires ongoing investment in data mapping and consent management systems. | Significant fine exposure; high operational overhead for multi-state compliance. |
| Supply Chain Labor | California Supply Chains Act; UFLPA enforcement. | Relies on supplier self-certification; does not audit or provide formal training. | High reputational risk; potential for import bans and significant shareholder/ESG scrutiny. |
Next Step: Legal and Compliance: Conduct a gap analysis between the company's current supplier certification process and the emerging EU/US mandatory human rights due diligence frameworks by the end of Q1 2026.
Citi Trends, Inc. (CTRN) - PESTLE Analysis: Environmental factors
Growing consumer and investor pressure for sustainable sourcing and ethical labor practices.
The market is demanding verifiable environmental, social, and governance (ESG) performance, not just promises. For a value retailer like Citi Trends, this pressure is acute, coming from two sides: the consumer and the capital markets. A Deloitte study shows that 83% of surveyed investors now incorporate sustainability information into their fundamental analyses, meaning your supply chain practices directly impact your valuation and cost of capital.
Citi Trends explicitly acknowledges the heightened business risk in its April 2025 Form 10-K, citing issues relating to compliance with domestic or international labor and environmental standards. While the company maintains 'strong, long-standing sourcing relationships,' the sheer volume of product needed to support 591 stores makes due diligence a continuous, complex, and costly exercise. You simply cannot afford a single ethical sourcing lapse in a multi-national supply chain.
Need to reduce packaging waste and improve efficiency in distribution center operations.
Reducing packaging waste is no longer a niche concern; it is a core consumer expectation. A 2025 consumer report indicates that 90% of shoppers are more likely to purchase from a brand or retailer if its packaging is eco-friendly. For an off-price model, this means balancing the cost of sustainable materials against the need for low-cost goods.
On the operational side, Citi Trends is focused on internal efficiencies that reduce waste and cost. The company is implementing an AI-based allocation system in the second half of fiscal 2025 to optimize inventory distribution across its store fleet. This move is defintely a win-win, as better inventory management inherently reduces waste from markdowns and overstock, contributing to the expected 210 to 230 basis points of gross margin expansion for the full year 2025. That's a direct financial return on efficiency.
- Optimize inventory distribution via AI in H2 2025.
- Reduce markdowns and associated product waste.
- Align with consumer preference for minimal packaging.
Climate change-related weather events pose a risk to store operations and supply chain logistics.
The physical risks of climate change are translating into direct financial hits for retailers with large store footprints across multiple climate zones. Citi Trends operates in 33 states across the U.S., making it vulnerable to regional extreme weather events. [cite: 3 (from search 1)] The company's forward-looking statements cite 'temporary changes in demand due to weather patterns' and 'interruptions in suppliers' businesses' as material risks.
The global economic impact of these events is escalating rapidly; total global economic losses from natural catastrophes rose to $162 billion in the first half of 2025 alone. [cite: 8 (from search 1)] For Citi Trends, this risk manifests as store closures from hurricanes and floods, delays in receiving product from overseas due to port disruptions, and increased insurance premiums. It's a recurring, non-negotiable cost of doing business in a warming world.
Mandatory reporting on Scope 1 and 2 carbon emissions is becoming a new compliance cost.
The global regulatory environment is shifting from voluntary disclosure to mandatory reporting, making carbon footprint management a compliance issue. New disclosure mandates on 'climate emissions' are a specific risk factor cited by Citi Trends, which the company expects could 'significantly escalate compliance costs.'
While specific Scope 1 (direct emissions from owned sources) and Scope 2 (indirect emissions from purchased energy) data for Citi Trends' fiscal 2025 operations are not publicly quantified, the cost of compliance is real. This includes the expense of implementing new data collection systems, hiring external ESG consultants, and auditing the data for accuracy. These new requirements will affect the company's planned $22 million to $25 million in full-year capital expenditures for 2025, as investments in energy efficiency for its distribution centers and stores will be necessary to manage these emissions.
| Environmental Factor | 2025 Financial/Operational Impact | Key Metric / Data Point |
|---|---|---|
| Investor Pressure (ESG) | Increased cost of capital and due diligence expenses. | 83% of investors use sustainability data in analysis. [cite: 8 (from search 1)] |
| Distribution Efficiency & Waste | Gross margin expansion from reduced waste/markdowns. | Gross margin expected to expand 210 to 230 basis points in FY2025. |
| Climate Change Risk | Supply chain disruption and store operational risk. | Global natural catastrophe economic losses hit $162 billion in H1 2025. [cite: 8 (from search 1)] |
| Carbon Emissions Reporting | Escalating compliance and CapEx for efficiency upgrades. | FY2025 CapEx expected to be $22 million to $25 million. |
Finance: Track the blended effective tariff rate monthly and forecast its impact on Q4 2025 COGS by the end of next week.
Disclaimer
All information, articles, and product details provided on this website are for general informational and educational purposes only. We do not claim any ownership over, nor do we intend to infringe upon, any trademarks, copyrights, logos, brand names, or other intellectual property mentioned or depicted on this site. Such intellectual property remains the property of its respective owners, and any references here are made solely for identification or informational purposes, without implying any affiliation, endorsement, or partnership.
We make no representations or warranties, express or implied, regarding the accuracy, completeness, or suitability of any content or products presented. Nothing on this website should be construed as legal, tax, investment, financial, medical, or other professional advice. In addition, no part of this site—including articles or product references—constitutes a solicitation, recommendation, endorsement, advertisement, or offer to buy or sell any securities, franchises, or other financial instruments, particularly in jurisdictions where such activity would be unlawful.
All content is of a general nature and may not address the specific circumstances of any individual or entity. It is not a substitute for professional advice or services. Any actions you take based on the information provided here are strictly at your own risk. You accept full responsibility for any decisions or outcomes arising from your use of this website and agree to release us from any liability in connection with your use of, or reliance upon, the content or products found herein.