
|
Docgo Inc. (DCGO) Avaliação DCF |
Totalmente Editável: Adapte-Se Às Suas Necessidades No Excel Ou Planilhas
Design Profissional: Modelos Confiáveis E Padrão Da Indústria
Pré-Construídos Para Uso Rápido E Eficiente
Compatível com MAC/PC, totalmente desbloqueado
Não É Necessária Experiência; Fácil De Seguir
DocGo Inc. (DCGO) Bundle
Procurando determinar o valor intrínseco da Docgo Inc.? Nossa calculadora DCGO DCF integra dados do mundo real com recursos abrangentes de personalização, permitindo refinar as previsões e aprimorar suas estratégias de investimento.
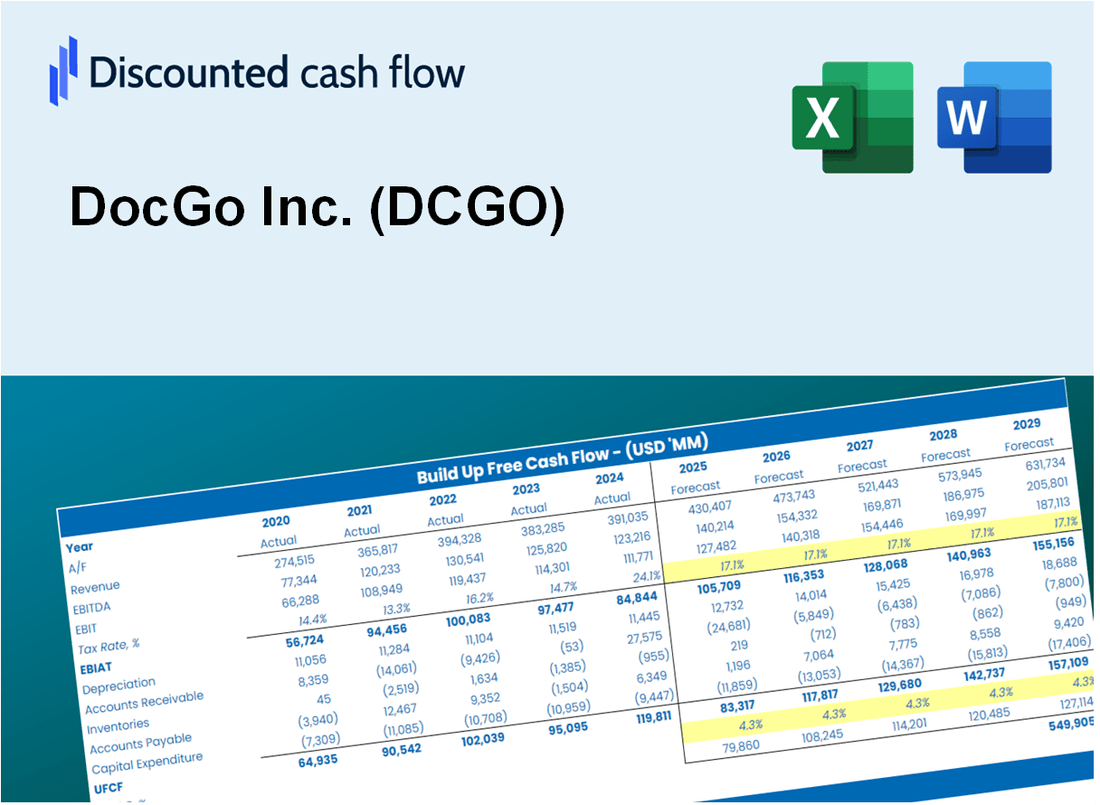
Discounted Cash Flow (DCF) - (USD MM)
| Year | AY1 2020 |
AY2 2021 |
AY3 2022 |
AY4 2023 |
AY5 2024 |
FY1 2025 |
FY2 2026 |
FY3 2027 |
FY4 2028 |
FY5 2029 |
|---|---|---|---|---|---|---|---|---|---|---|
| Revenue | 94.1 | 318.7 | 440.5 | 624.3 | 616.6 | 892.0 | 1,290.5 | 1,867.0 | 2,701.0 | 3,907.6 |
| Revenue Growth, % | 0 | 238.74 | 38.21 | 41.72 | -1.24 | 44.67 | 44.67 | 44.67 | 44.67 | 44.67 |
| EBITDA | -9.3 | 28.1 | 32.4 | 31.5 | 45.6 | 33.5 | 48.4 | 70.1 | 101.4 | 146.6 |
| EBITDA, % | -9.83 | 8.81 | 7.35 | 5.04 | 7.39 | 3.75 | 3.75 | 3.75 | 3.75 | 3.75 |
| Depreciation | 5.5 | 7.5 | 10.6 | 16.4 | 15.9 | 28.2 | 40.8 | 59.1 | 85.4 | 123.6 |
| Depreciation, % | 5.85 | 2.36 | 2.4 | 2.63 | 2.58 | 3.16 | 3.16 | 3.16 | 3.16 | 3.16 |
| EBIT | -14.8 | 20.6 | 21.8 | 15.1 | 29.7 | 5.3 | 7.6 | 11.0 | 15.9 | 23.0 |
| EBIT, % | -15.68 | 6.45 | 4.96 | 2.41 | 4.81 | 0.58935 | 0.58935 | 0.58935 | 0.58935 | 0.58935 |
| Total Cash | 32.4 | 175.5 | 157.3 | 59.3 | 89.2 | 266.2 | 385.1 | 557.2 | 806.1 | 1,166.2 |
| Total Cash, percent | .0 | .0 | .0 | .0 | .0 | .0 | .0 | .0 | .0 | .0 |
| Account Receivables | 24.9 | 78.4 | 103.0 | 262.1 | 210.9 | 268.6 | 388.6 | 562.2 | 813.4 | 1,176.8 |
| Account Receivables, % | 26.42 | 24.59 | 23.38 | 41.98 | 34.21 | 30.12 | 30.12 | 30.12 | 30.12 | 30.12 |
| Inventories | .0 | .0 | 4.5 | .0 | .0 | 1.8 | 2.6 | 3.8 | 5.5 | 7.9 |
| Inventories, % | 0 | 0 | 1.02 | 0 | 0 | 0.20341 | 0.20341 | 0.20341 | 0.20341 | 0.20341 |
| Accounts Payable | 4.0 | 15.8 | 21.6 | 19.8 | 28.4 | 39.0 | 56.4 | 81.6 | 118.0 | 170.7 |
| Accounts Payable, % | 4.2 | 4.97 | 4.9 | 3.18 | 4.6 | 4.37 | 4.37 | 4.37 | 4.37 | 4.37 |
| Capital Expenditure | -6.3 | -6.7 | -5.5 | -10.1 | -5.8 | -22.5 | -32.6 | -47.1 | -68.2 | -98.6 |
| Capital Expenditure, % | -6.71 | -2.09 | -1.25 | -1.62 | -0.94659 | -2.52 | -2.52 | -2.52 | -2.52 | -2.52 |
| Tax Rate, % | 27.95 | 27.95 | 27.95 | 27.95 | 27.95 | 27.95 | 27.95 | 27.95 | 27.95 | 27.95 |
| EBITAT | -14.5 | 24.7 | 33.1 | 6.3 | 21.4 | 4.3 | 6.3 | 9.1 | 13.1 | 19.0 |
| Depreciation | ||||||||||
| Changes in Account Receivables | ||||||||||
| Changes in Inventories | ||||||||||
| Changes in Accounts Payable | ||||||||||
| Capital Expenditure | ||||||||||
| UFCF | -36.2 | -16.1 | 14.9 | -143.7 | 91.1 | -38.9 | -88.9 | -128.6 | -186.0 | -269.1 |
| WACC, % | 6.67 | 6.7 | 6.7 | 5.98 | 6.35 | 6.48 | 6.48 | 6.48 | 6.48 | 6.48 |
| PV UFCF | ||||||||||
| SUM PV UFCF | -562.8 | |||||||||
| Long Term Growth Rate, % | 2.00 | |||||||||
| Free cash flow (T + 1) | -275 | |||||||||
| Terminal Value | -6,131 | |||||||||
| Present Terminal Value | -4,480 | |||||||||
| Enterprise Value | -5,043 | |||||||||
| Net Debt | -32 | |||||||||
| Equity Value | -5,011 | |||||||||
| Diluted Shares Outstanding, MM | 109 | |||||||||
| Equity Value Per Share | -45.79 |
What You Will Receive
- Adjustable Forecast Parameters: Seamlessly modify key assumptions (growth %, margins, WACC) to explore various scenarios.
- Comprehensive Data: DocGo Inc.'s (DCGO) financial data pre-loaded to facilitate your analysis.
- Instant DCF Calculations: The template automatically computes Net Present Value (NPV) and intrinsic value for you.
- Tailored and Professional: A refined Excel model that conforms to your valuation requirements.
- Designed for Analysts and Investors: Perfect for evaluating projections, confirming strategies, and optimizing efficiency.
Key Features
- Comprehensive Data: DocGo Inc.’s historical financial records and pre-filled projections.
- Customizable Parameters: Adjust WACC, tax rates, revenue growth, and EBITDA margins to fit your analysis.
- Real-Time Insights: Monitor DocGo Inc.’s intrinsic value as it updates instantly.
- Intuitive Visualizations: Dashboard graphs illustrate valuation outcomes and essential metrics.
- Designed for Precision: A robust tool tailored for analysts, investors, and finance professionals.
How It Works
- 1. Access the Template: Download and open the Excel file featuring DocGo Inc.'s (DCGO) preloaded data.
- 2. Adjust Key Inputs: Modify essential variables such as growth rates, WACC, and capital expenditures.
- 3. Instant Results: The DCF model automatically computes intrinsic value and NPV in real-time.
- 4. Explore Different Scenarios: Evaluate various forecasts to understand different valuation results.
- 5. Present with Assurance: Share professional valuation insights to back your strategic decisions.
Why Choose the DocGo Inc. (DCGO) Calculator?
- Precision: Utilizes real DocGo financials for reliable data accuracy.
- Adaptability: Built for users to easily adjust and experiment with inputs.
- Efficiency: Avoid the complexity of constructing a financial model from the ground up.
- Expert-Quality: Crafted with the expertise and usability expected at the CFO level.
- Intuitive: Simple to navigate, suitable for users without extensive financial modeling background.
Who Should Use DocGo Inc. (DCGO)?
- Healthcare Professionals: Streamline patient care with innovative telehealth solutions.
- Investors: Gain insights into a rapidly growing sector with a focus on technology-driven healthcare.
- Health Administrators: Enhance operational efficiency with integrated service offerings.
- Tech Enthusiasts: Explore cutting-edge advancements in healthcare technology and their applications.
- Students and Educators: Utilize real-world case studies for learning about healthcare innovation and management.
What the Template Contains
- Operating and Balance Sheet Data: Pre-filled DocGo Inc. (DCGO) historical data and forecasts, including revenue, EBITDA, EBIT, and capital expenditures.
- WACC Calculation: A dedicated sheet for Weighted Average Cost of Capital (WACC), featuring parameters such as Beta, risk-free rate, and share price.
- DCF Valuation (Unlevered and Levered): Editable Discounted Cash Flow models illustrating intrinsic value with comprehensive calculations.
- Financial Statements: Pre-loaded financial statements (annual and quarterly) to facilitate analysis.
- Key Ratios: Includes profitability, leverage, and efficiency ratios for DocGo Inc. (DCGO).
- Dashboard and Charts: Visual summary of valuation outputs and assumptions for easy result analysis.
Disclaimer
All information, articles, and product details provided on this website are for general informational and educational purposes only. We do not claim any ownership over, nor do we intend to infringe upon, any trademarks, copyrights, logos, brand names, or other intellectual property mentioned or depicted on this site. Such intellectual property remains the property of its respective owners, and any references here are made solely for identification or informational purposes, without implying any affiliation, endorsement, or partnership.
We make no representations or warranties, express or implied, regarding the accuracy, completeness, or suitability of any content or products presented. Nothing on this website should be construed as legal, tax, investment, financial, medical, or other professional advice. In addition, no part of this site—including articles or product references—constitutes a solicitation, recommendation, endorsement, advertisement, or offer to buy or sell any securities, franchises, or other financial instruments, particularly in jurisdictions where such activity would be unlawful.
All content is of a general nature and may not address the specific circumstances of any individual or entity. It is not a substitute for professional advice or services. Any actions you take based on the information provided here are strictly at your own risk. You accept full responsibility for any decisions or outcomes arising from your use of this website and agree to release us from any liability in connection with your use of, or reliance upon, the content or products found herein.