
|
Telefonaktiebolaget LM Ericsson (publ) (ERIC) DCF Avaliação |
Totalmente Editável: Adapte-Se Às Suas Necessidades No Excel Ou Planilhas
Design Profissional: Modelos Confiáveis E Padrão Da Indústria
Pré-Construídos Para Uso Rápido E Eficiente
Compatível com MAC/PC, totalmente desbloqueado
Não É Necessária Experiência; Fácil De Seguir
Telefonaktiebolaget LM Ericsson (publ) (ERIC) Bundle
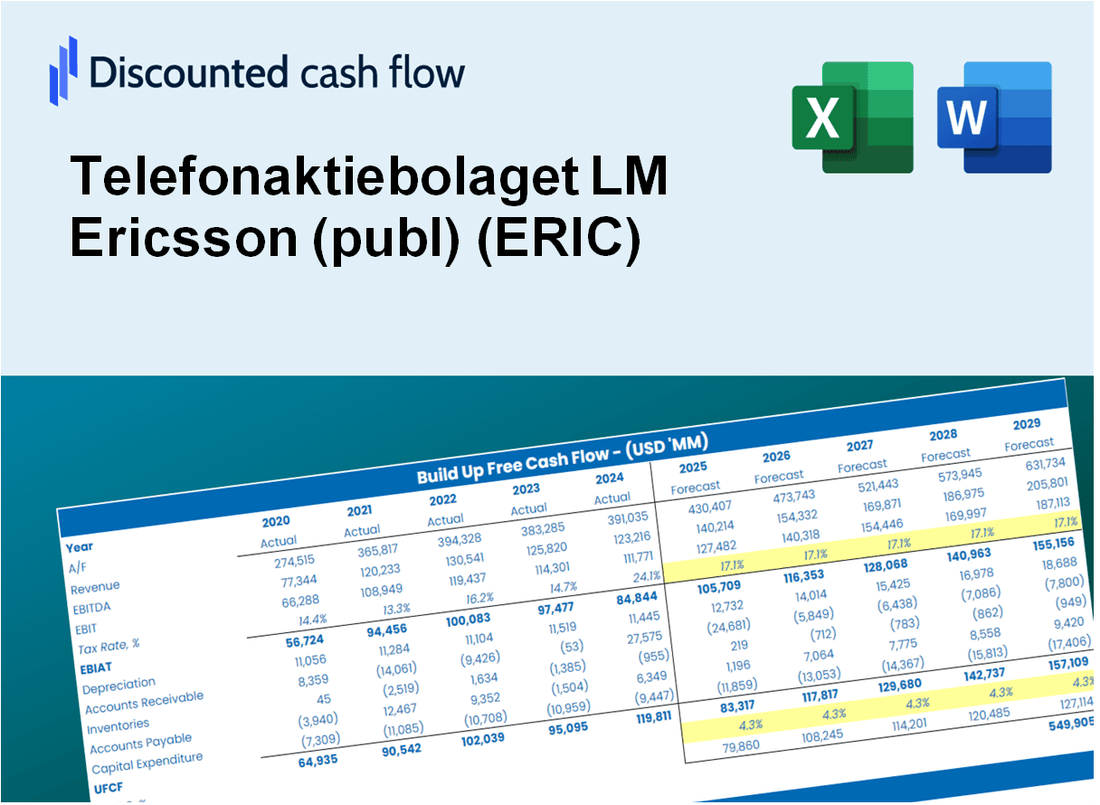
Otimize seu tempo e melhore a precisão com a nossa calculadora DCF (ERIC)! Utilizando dados reais de Ericsson e suposições personalizáveis, essa ferramenta o capacita a prever, analisar e avaliar o Telefonaktiebolaget LM Ericsson (publ) como um investidor experiente.
What You Will Get
- Flexible Forecast Inputs: Quickly adjust key assumptions (growth %, margins, WACC) to explore various scenarios.
- Comprehensive Market Data: Ericsson’s financial data pre-loaded to facilitate your analysis.
- Instant DCF Calculations: The template automatically computes Net Present Value (NPV) and intrinsic value for you.
- Tailored and Professional Design: A refined Excel model that caters to your valuation requirements.
- Designed for Analysts and Investors: Perfect for evaluating projections, verifying strategies, and enhancing efficiency.
Key Features
- 🔍 Real-Life ERIC Financials: Pre-filled historical and projected data for Telefonaktiebolaget LM Ericsson (publ).
- ✏️ Fully Customizable Inputs: Adjust all critical parameters (yellow cells) like WACC, growth %, and tax rates.
- 📊 Professional DCF Valuation: Built-in formulas calculate Ericsson’s intrinsic value using the Discounted Cash Flow method.
- ⚡ Instant Results: Visualize Ericsson’s valuation instantly after making changes.
- Scenario Analysis: Test and compare outcomes for various financial assumptions side-by-side.
How It Works
- Step 1: Download the prebuilt Excel template containing Telefonaktiebolaget LM Ericsson’s (ERIC) data.
- Step 2: Navigate through the pre-filled sheets to grasp the essential metrics.
- Step 3: Adjust forecasts and assumptions in the editable yellow cells (WACC, growth, margins).
- Step 4: Immediately see the recalculated results, including Telefonaktiebolaget LM Ericsson’s (ERIC) intrinsic value.
- Step 5: Utilize the outputs to make informed investment decisions or create reports.
Why Choose This Calculator?
- User-Friendly Interface: Perfect for both novices and seasoned professionals.
- Customizable Inputs: Adjust parameters easily to suit your financial analysis.
- Real-Time Adjustments: Witness immediate updates to Telefonaktiebolaget LM Ericsson’s valuation as you change inputs.
- Preloaded Data: Comes with Telefonaktiebolaget LM Ericsson's actual financial figures for fast evaluation.
- Preferred by Experts: Valued by investors and analysts for making well-informed choices.
Who Should Use This Product?
- Professional Investors: Develop comprehensive and accurate valuation models for portfolio assessment.
- Corporate Finance Teams: Evaluate valuation scenarios to inform internal decision-making strategies.
- Consultants and Advisors: Deliver precise valuation insights for Telefonaktiebolaget LM Ericsson (ERIC).
- Students and Educators: Utilize real-world data to practice and instruct on financial modeling techniques.
- Tech Enthusiasts: Gain insights into how technology companies like Telefonaktiebolaget LM Ericsson (ERIC) are valued in the marketplace.
What the Template Contains
- Pre-Filled Data: Includes Telefonaktiebolaget LM Ericsson’s historical financials and forecasts.
- Discounted Cash Flow Model: Editable DCF valuation model with automatic calculations.
- Weighted Average Cost of Capital (WACC): A dedicated sheet for calculating WACC based on custom inputs.
- Key Financial Ratios: Analyze Telefonaktiebolaget LM Ericsson’s profitability, efficiency, and leverage.
- Customizable Inputs: Edit revenue growth, margins, and tax rates with ease.
- Clear Dashboard: Charts and tables summarizing key valuation results.
Disclaimer
All information, articles, and product details provided on this website are for general informational and educational purposes only. We do not claim any ownership over, nor do we intend to infringe upon, any trademarks, copyrights, logos, brand names, or other intellectual property mentioned or depicted on this site. Such intellectual property remains the property of its respective owners, and any references here are made solely for identification or informational purposes, without implying any affiliation, endorsement, or partnership.
We make no representations or warranties, express or implied, regarding the accuracy, completeness, or suitability of any content or products presented. Nothing on this website should be construed as legal, tax, investment, financial, medical, or other professional advice. In addition, no part of this site—including articles or product references—constitutes a solicitation, recommendation, endorsement, advertisement, or offer to buy or sell any securities, franchises, or other financial instruments, particularly in jurisdictions where such activity would be unlawful.
All content is of a general nature and may not address the specific circumstances of any individual or entity. It is not a substitute for professional advice or services. Any actions you take based on the information provided here are strictly at your own risk. You accept full responsibility for any decisions or outcomes arising from your use of this website and agree to release us from any liability in connection with your use of, or reliance upon, the content or products found herein.