
|
Avaliação DCF do FirstGroup PLC (FGP.L) |
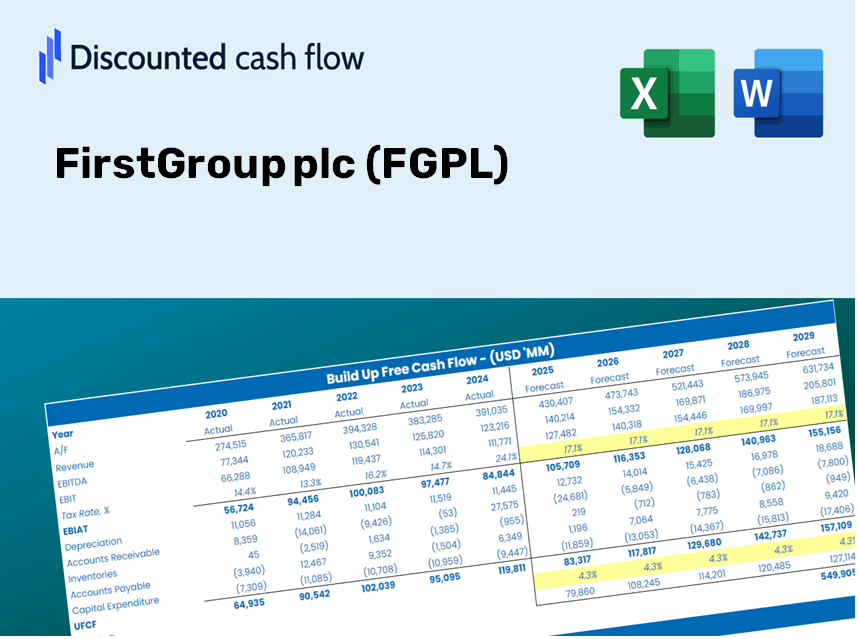
Totalmente Editável: Adapte-Se Às Suas Necessidades No Excel Ou Planilhas
Design Profissional: Modelos Confiáveis E Padrão Da Indústria
Pré-Construídos Para Uso Rápido E Eficiente
Compatível com MAC/PC, totalmente desbloqueado
Não É Necessária Experiência; Fácil De Seguir
FirstGroup plc (FGP.L) Bundle
Procurando avaliar o valor intrínseco do FirstGroup PLC? Nossa calculadora DCF (FGPL) integra dados do mundo real com recursos abrangentes de personalização, permitindo ajustar as previsões e aprimorar suas estratégias de investimento.
What You Will Receive
- Authentic FirstGroup Data: Preloaded financials – including revenue and EBIT – derived from actual and projected figures.
- Comprehensive Customization: Modify all essential parameters (yellow cells) such as WACC, growth %, and tax rates.
- Instant Valuation Updates: Automatic recalculations to assess the effects of changes on FirstGroup's fair value.
- Flexible Excel Template: Designed for quick adjustments, scenario testing, and thorough projections.
- Efficient and Precise: Avoid starting models from the ground up while ensuring accuracy and adaptability.
Key Features
- Comprehensive FGPL Data: Pre-loaded with FirstGroup plc's historical financial performance and future projections.
- Fully Customizable Inputs: Modify revenue growth rates, profit margins, discount rates, tax percentages, and capital investments.
- Dynamic Valuation Model: Automatically recalculates Net Present Value (NPV) and intrinsic value based on your adjustments.
- Scenario Analysis: Build various forecasting scenarios to evaluate different valuation results.
- User-Friendly Interface: Intuitive, organized, and suitable for both seasoned professionals and newcomers.
How It Operates
- Step 1: Download the Excel file.
- Step 2: Examine FirstGroup plc’s (FGPL) pre-filled financial data and projections.
- Step 3: Adjust key inputs such as revenue growth, WACC, and tax rates (highlighted cells).
- Step 4: Observe the DCF model refresh in real-time as you modify your assumptions.
- Step 5: Evaluate the outputs and apply the findings for your investment strategies.
Why Opt for This Calculator?
- Reliable Data: Accurate financials from FirstGroup plc (FGPL) ensure trustworthy valuation outcomes.
- Flexible Options: Modify essential parameters like growth rates, WACC, and tax rates to fit your forecasts.
- Efficiency Boost: Pre-configured calculations save time and eliminate the hassle of starting from zero.
- Expert-Level Tool: Tailored for investors, analysts, and consultants in the field.
- User-Friendly Experience: A straightforward design and guided instructions make it accessible for everyone.
Who Can Benefit from This Product?
- Investors: Evaluate the fair value of FirstGroup plc (FGPL) to inform investment choices.
- CFOs: Utilize a sophisticated DCF model for enhanced financial reporting and analysis.
- Consultants: Easily customize the template for client valuation reports.
- Entrepreneurs: Discover financial modeling techniques employed by major corporations.
- Educators: Implement it as a resource to illustrate valuation principles in the classroom.
Contents of the Template
- Preloaded FGPL Data: Historical and projected financial information, encompassing revenue, EBIT, and capital expenditures.
- DCF and WACC Models: Professional-grade sheets designed for calculating intrinsic value and Weighted Average Cost of Capital.
- Editable Inputs: Yellow-highlighted cells for customizing revenue growth, tax rates, and discount rates.
- Financial Statements: Detailed annual and quarterly financials for in-depth analysis.
- Key Ratios: Profitability, leverage, and efficiency ratios to assess performance.
- Dashboard and Charts: Visual representations of valuation results and underlying assumptions.
Disclaimer
All information, articles, and product details provided on this website are for general informational and educational purposes only. We do not claim any ownership over, nor do we intend to infringe upon, any trademarks, copyrights, logos, brand names, or other intellectual property mentioned or depicted on this site. Such intellectual property remains the property of its respective owners, and any references here are made solely for identification or informational purposes, without implying any affiliation, endorsement, or partnership.
We make no representations or warranties, express or implied, regarding the accuracy, completeness, or suitability of any content or products presented. Nothing on this website should be construed as legal, tax, investment, financial, medical, or other professional advice. In addition, no part of this site—including articles or product references—constitutes a solicitation, recommendation, endorsement, advertisement, or offer to buy or sell any securities, franchises, or other financial instruments, particularly in jurisdictions where such activity would be unlawful.
All content is of a general nature and may not address the specific circumstances of any individual or entity. It is not a substitute for professional advice or services. Any actions you take based on the information provided here are strictly at your own risk. You accept full responsibility for any decisions or outcomes arising from your use of this website and agree to release us from any liability in connection with your use of, or reliance upon, the content or products found herein.