
|
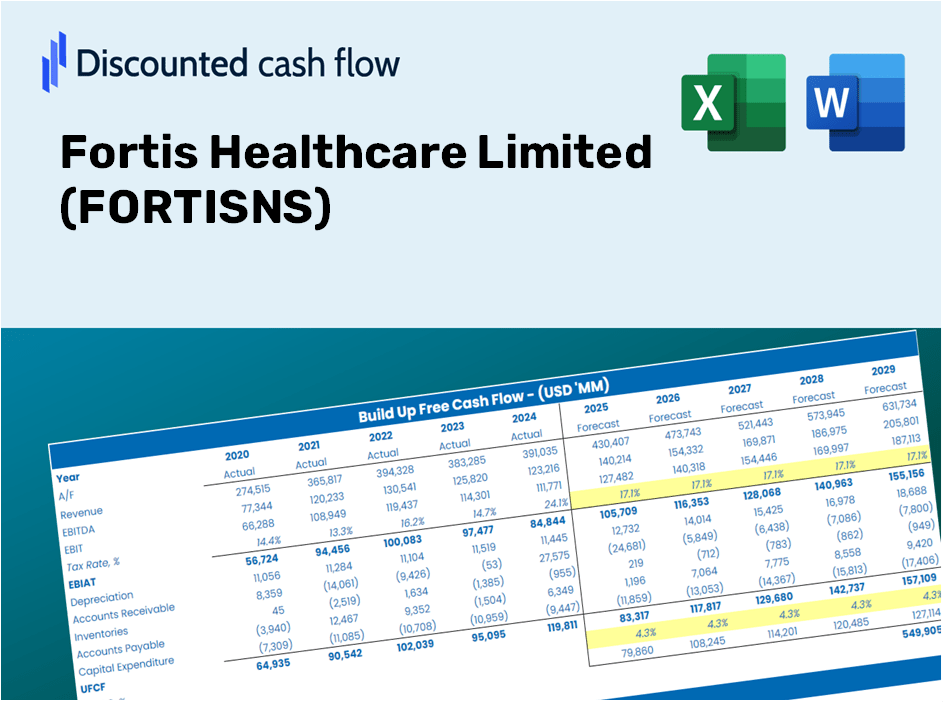
Avaliação DCF da Fortis HealthCare Limited Limited (Fortis.NS) |
Totalmente Editável: Adapte-Se Às Suas Necessidades No Excel Ou Planilhas
Design Profissional: Modelos Confiáveis E Padrão Da Indústria
Pré-Construídos Para Uso Rápido E Eficiente
Compatível com MAC/PC, totalmente desbloqueado
Não É Necessária Experiência; Fácil De Seguir
Fortis Healthcare Limited (FORTIS.NS) Bundle
Otimize seu tempo e melhore a precisão com nossa calculadora DCF (Fortisns)! Utilizando dados reais da Fortis Healthcare Limited e suposições personalizáveis, essa ferramenta permite que você preveja, analise e valorse (Fortisns) como um investidor experiente.
Benefits of Using Our Model
- Adjustable Forecast Parameters: Modify key assumptions (growth %, margins, WACC) effortlessly to explore various scenarios.
- Relevant Financial Data: Fortis Healthcare Limited’s financial information pre-loaded for seamless analysis.
- Instant DCF Calculations: The template automatically computes Net Present Value (NPV) and intrinsic value for your convenience.
- Tailored and Professional Design: A refined Excel model designed to meet your valuation requirements.
- Crafted for Analysts and Investors: Perfect for evaluating forecasts, affirming strategies, and enhancing efficiency.
Key Features
- Comprehensive FORTISNS Data: Comes pre-loaded with Fortis Healthcare’s historical financial information and future projections.
- Fully Customizable Parameters: Modify revenue growth rates, profit margins, discount rates (WACC), tax rates, and capital expenditures to fit your analysis.
- Dynamic Valuation Framework: Automatically calculates and updates the Net Present Value (NPV) and intrinsic value as you adjust inputs.
- Scenario Analysis: Develop various forecasting scenarios to evaluate differing valuation outcomes.
- Intuitive User Interface: Clean and organized design suitable for both experienced professionals and newcomers.
How It Works
- Step 1: Download the Excel file for Fortis Healthcare Limited (FORTISNS).
- Step 2: Examine the pre-filled financial data and forecasts provided by Fortis Healthcare.
- Step 3: Adjust key inputs such as revenue growth, WACC, and tax rates (highlighted cells).
- Step 4: Observe the DCF model refresh in real-time as you modify your assumptions.
- Step 5: Evaluate the results and leverage the insights for your investment strategies.
Why Opt for Fortis Healthcare Limited (FORTISNS)?
- Time-Efficient: Access ready-to-use resources without the hassle of starting from zero.
- Enhanced Accuracy: Utilize dependable healthcare data and calculations to minimize valuation errors.
- Completely Customizable: Adjust the tools to align with your specific healthcare insights and forecasts.
- Easy to Understand: Intuitive charts and outputs simplify the analysis of results.
- Endorsed by Professionals: Preferred by experts who prioritize accuracy and functionality.
Who Can Benefit from Our Services?
- Individual Investors: Make informed choices regarding the purchase or sale of Fortis Healthcare Limited (FORTISNS) shares.
- Financial Analysts: Enhance valuation methodologies with pre-built financial models tailored for Fortis Healthcare Limited (FORTISNS).
- Consultants: Provide clients with accurate and timely valuation insights related to Fortis Healthcare Limited (FORTISNS).
- Business Owners: Gain a deeper understanding of how large organizations like Fortis Healthcare Limited (FORTISNS) are valued to inform your strategic decisions.
- Finance Students: Explore valuation principles using real-world data and case studies focused on Fortis Healthcare Limited (FORTISNS).
Contents of the Template
- Pre-Filled Data: Contains Fortis Healthcare Limited's historical financials and projections.
- Discounted Cash Flow Model: An editable DCF valuation model featuring automatic calculations.
- Weighted Average Cost of Capital (WACC): A specific sheet for determining WACC using custom inputs.
- Key Financial Ratios: Examine Fortis's profitability, operational efficiency, and financial leverage.
- Customizable Inputs: Easily modify revenue growth, profit margins, and tax rates.
- Clear Dashboard: Visual representations and tables summarizing essential valuation outcomes.
Disclaimer
All information, articles, and product details provided on this website are for general informational and educational purposes only. We do not claim any ownership over, nor do we intend to infringe upon, any trademarks, copyrights, logos, brand names, or other intellectual property mentioned or depicted on this site. Such intellectual property remains the property of its respective owners, and any references here are made solely for identification or informational purposes, without implying any affiliation, endorsement, or partnership.
We make no representations or warranties, express or implied, regarding the accuracy, completeness, or suitability of any content or products presented. Nothing on this website should be construed as legal, tax, investment, financial, medical, or other professional advice. In addition, no part of this site—including articles or product references—constitutes a solicitation, recommendation, endorsement, advertisement, or offer to buy or sell any securities, franchises, or other financial instruments, particularly in jurisdictions where such activity would be unlawful.
All content is of a general nature and may not address the specific circumstances of any individual or entity. It is not a substitute for professional advice or services. Any actions you take based on the information provided here are strictly at your own risk. You accept full responsibility for any decisions or outcomes arising from your use of this website and agree to release us from any liability in connection with your use of, or reliance upon, the content or products found herein.