
|
Ihuman Inc. (IH) Avaliação DCF |
Totalmente Editável: Adapte-Se Às Suas Necessidades No Excel Ou Planilhas
Design Profissional: Modelos Confiáveis E Padrão Da Indústria
Pré-Construídos Para Uso Rápido E Eficiente
Compatível com MAC/PC, totalmente desbloqueado
Não É Necessária Experiência; Fácil De Seguir
iHuman Inc. (IH) Bundle
Descubra o verdadeiro potencial da Ihuman Inc. (IH) com nossa calculadora DCF avançada! Ajuste as suposições críticas, explore vários cenários e avalie como diferentes fatores influenciam a avaliação da Ihuman Inc. (IH) - tudo dentro de um único modelo do Excel.
What You Will Get
- Comprehensive IH Financials: Access to historical and projected data for precise valuation.
- Customizable Inputs: Adjust WACC, tax rates, revenue growth, and capital expenditures as needed.
- Real-Time Calculations: Intrinsic value and NPV are computed automatically.
- Scenario Analysis: Explore various scenarios to assess iHuman Inc.'s future performance.
- User-Friendly Interface: Designed for professionals while remaining approachable for newcomers.
Key Features
- Comprehensive iHuman Data: Pre-filled with iHuman Inc.'s historical performance metrics and future projections.
- Fully Customizable Inputs: Modify user engagement rates, growth trajectories, operating costs, and investment strategies.
- Dynamic Valuation Model: Instant updates to Net Present Value (NPV) and intrinsic value based on your parameters.
- Scenario Testing: Develop various forecasting scenarios to evaluate different valuation possibilities.
- User-Friendly Design: Intuitive, organized, and tailored for both seasoned professionals and newcomers.
How It Works
- Step 1: Download the prebuilt Excel template featuring iHuman Inc.’s (IH) data.
- Step 2: Navigate through the pre-filled sheets to grasp the essential metrics.
- Step 3: Modify forecasts and assumptions in the editable yellow cells (WACC, growth, margins).
- Step 4: Instantly view recalculated results, including iHuman Inc.’s (IH) intrinsic value.
- Step 5: Make informed investment decisions or generate reports based on the outputs.
Why Choose iHuman Inc. (IH) Calculator?
- User-Friendly Interface: Tailored for both novices and seasoned professionals.
- Customizable Inputs: Adjust parameters to suit your specific analysis needs.
- Real-Time Feedback: Observe immediate updates to iHuman's valuation as you change inputs.
- Pre-Configured Data: Comes with iHuman's latest financial statistics for swift evaluations.
- Preferred by Experts: Utilized by investors and analysts for making well-informed choices.
Who Should Use This Product?
- Professional Investors: Develop comprehensive and dependable valuation models for analyzing portfolios involving iHuman Inc. (IH).
- Corporate Finance Teams: Evaluate valuation scenarios to inform strategic decisions within their organizations.
- Consultants and Advisors: Deliver precise valuation insights to clients regarding iHuman Inc. (IH) stock.
- Students and Educators: Leverage real-world data to enhance learning and practice in financial modeling.
- Tech Enthusiasts: Gain insights into the valuation methodologies applied to tech companies like iHuman Inc. (IH).
What the Template Contains
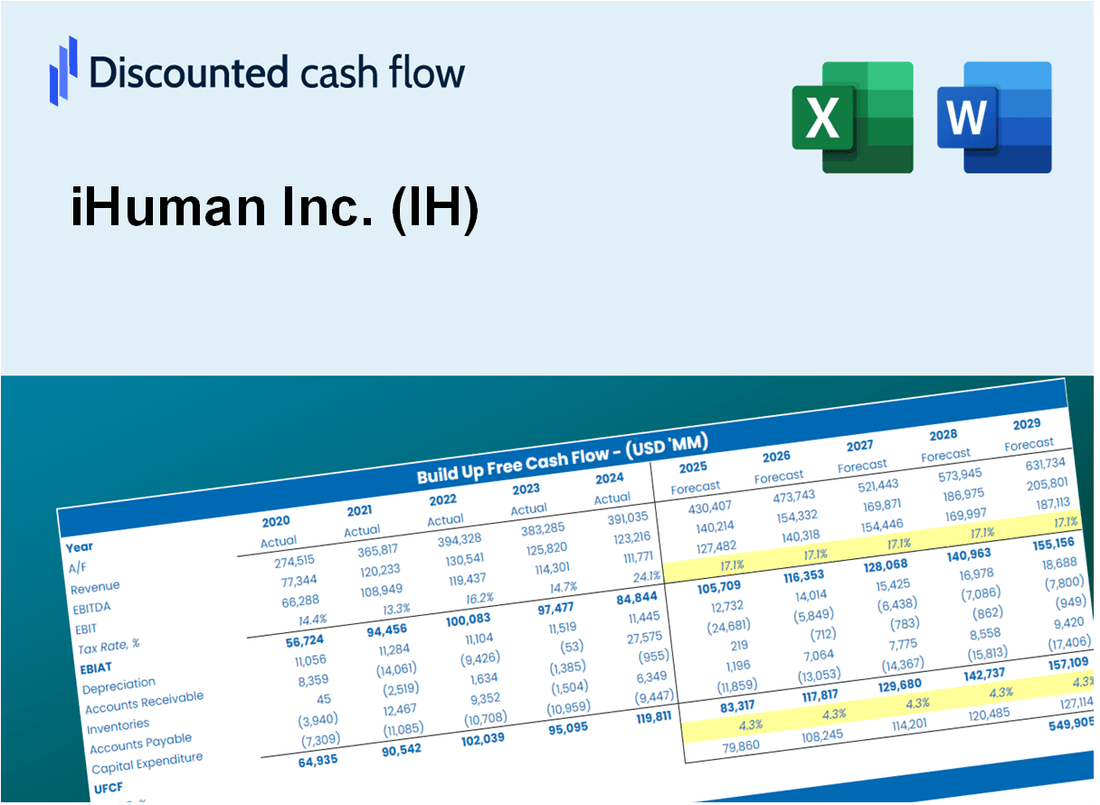
- Operating and Balance Sheet Data: Pre-filled iHuman Inc. (IH) historical data and forecasts, including revenue, EBITDA, EBIT, and capital expenditures.
- WACC Calculation: A dedicated sheet for Weighted Average Cost of Capital (WACC), including parameters like Beta, risk-free rate, and share price.
- DCF Valuation (Unlevered and Levered): Editable Discounted Cash Flow models showing intrinsic value with detailed calculations.
- Financial Statements: Pre-loaded financial statements (annual and quarterly) to support analysis.
- Key Ratios: Includes profitability, leverage, and efficiency ratios for iHuman Inc. (IH).
- Dashboard and Charts: Visual summary of valuation outputs and assumptions to analyze results easily.
Disclaimer
All information, articles, and product details provided on this website are for general informational and educational purposes only. We do not claim any ownership over, nor do we intend to infringe upon, any trademarks, copyrights, logos, brand names, or other intellectual property mentioned or depicted on this site. Such intellectual property remains the property of its respective owners, and any references here are made solely for identification or informational purposes, without implying any affiliation, endorsement, or partnership.
We make no representations or warranties, express or implied, regarding the accuracy, completeness, or suitability of any content or products presented. Nothing on this website should be construed as legal, tax, investment, financial, medical, or other professional advice. In addition, no part of this site—including articles or product references—constitutes a solicitation, recommendation, endorsement, advertisement, or offer to buy or sell any securities, franchises, or other financial instruments, particularly in jurisdictions where such activity would be unlawful.
All content is of a general nature and may not address the specific circumstances of any individual or entity. It is not a substitute for professional advice or services. Any actions you take based on the information provided here are strictly at your own risk. You accept full responsibility for any decisions or outcomes arising from your use of this website and agree to release us from any liability in connection with your use of, or reliance upon, the content or products found herein.