
|
Avaliação DCF Incorporated Incorporated (INGR) Ingredion (INGR) |
Totalmente Editável: Adapte-Se Às Suas Necessidades No Excel Ou Planilhas
Design Profissional: Modelos Confiáveis E Padrão Da Indústria
Pré-Construídos Para Uso Rápido E Eficiente
Compatível com MAC/PC, totalmente desbloqueado
Não É Necessária Experiência; Fácil De Seguir
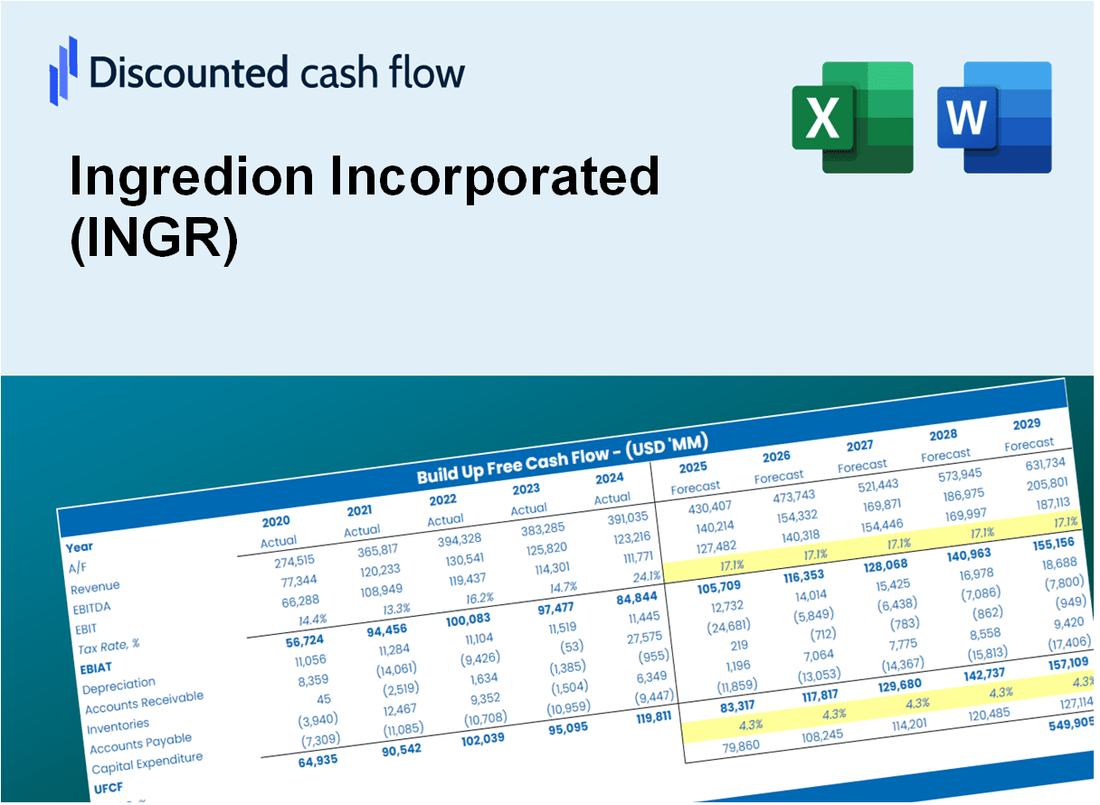
Ingredion Incorporated (INGR) Bundle
Seja você um investidor ou analista, esta calculadora DCF (InGR) é sua ferramenta preferida para uma avaliação precisa. Equipado com dados reais da Ingredion Incorporated, você pode ajustar as previsões e ver os resultados em tempo real.
What You Will Get
- Comprehensive INGR Financials: Access historical and projected data for precise valuation.
- Customizable Inputs: Adjust WACC, tax rates, revenue growth, and capital expenditures as needed.
- Dynamic Calculations: Intrinsic value and NPV are computed in real-time.
- Scenario Analysis: Evaluate various scenarios to assess Ingredion's future performance.
- User-Friendly Design: Designed for professionals while remaining approachable for newcomers.
Key Features
- 🔍 Real-Life INGR Financials: Pre-filled historical and projected data for Ingredion Incorporated (INGR).
- ✏️ Fully Customizable Inputs: Adjust all critical parameters (yellow cells) like WACC, growth %, and tax rates.
- 📊 Professional DCF Valuation: Built-in formulas calculate Ingredion’s intrinsic value using the Discounted Cash Flow method.
- ⚡ Instant Results: Visualize Ingredion’s valuation instantly after making changes.
- Scenario Analysis: Test and compare outcomes for various financial assumptions side-by-side.
How It Works
- Download: Obtain the pre-built Excel file featuring Ingredion Incorporated’s (INGR) financial data.
- Customize: Modify projections, including revenue growth, EBITDA %, and WACC as needed.
- Update Automatically: The intrinsic value and NPV calculations refresh in real-time.
- Test Scenarios: Develop various forecasts and analyze results immediately.
- Make Decisions: Leverage the valuation outcomes to inform your investment approach.
Why Choose Ingredion Incorporated (INGR)?
- Innovative Solutions: Access a wide range of ingredient solutions tailored for various industries.
- Commitment to Quality: High standards in sourcing and production ensure consistent product excellence.
- Sustainability Focus: Engage in practices that promote environmental responsibility and sustainability.
- Expert Support: Benefit from a dedicated team of experts ready to assist with your specific needs.
- Global Reach: Leverage Ingredion's extensive network to enhance your supply chain efficiency.
Who Should Use This Product?
- Investors: Accurately assess Ingredion Incorporated’s (INGR) fair value prior to making investment choices.
- CFOs: Utilize a professional-grade DCF model for financial reporting and analysis related to Ingredion Incorporated (INGR).
- Consultants: Efficiently modify the template for valuation reports tailored to clients involving Ingredion Incorporated (INGR).
- Entrepreneurs: Discover insights into financial modeling practices employed by leading companies like Ingredion Incorporated (INGR).
- Educators: Implement it as a teaching resource to illustrate valuation methodologies using Ingredion Incorporated (INGR) as a case study.
What the Template Contains
- Operating and Balance Sheet Data: Pre-filled Ingredion Incorporated (INGR) historical data and forecasts, including revenue, EBITDA, EBIT, and capital expenditures.
- WACC Calculation: A dedicated sheet for Weighted Average Cost of Capital (WACC), including parameters like Beta, risk-free rate, and share price.
- DCF Valuation (Unlevered and Levered): Editable Discounted Cash Flow models showing intrinsic value with detailed calculations.
- Financial Statements: Pre-loaded financial statements (annual and quarterly) to support analysis.
- Key Ratios: Includes profitability, leverage, and efficiency ratios for Ingredion Incorporated (INGR).
- Dashboard and Charts: Visual summary of valuation outputs and assumptions to analyze results easily.
Disclaimer
All information, articles, and product details provided on this website are for general informational and educational purposes only. We do not claim any ownership over, nor do we intend to infringe upon, any trademarks, copyrights, logos, brand names, or other intellectual property mentioned or depicted on this site. Such intellectual property remains the property of its respective owners, and any references here are made solely for identification or informational purposes, without implying any affiliation, endorsement, or partnership.
We make no representations or warranties, express or implied, regarding the accuracy, completeness, or suitability of any content or products presented. Nothing on this website should be construed as legal, tax, investment, financial, medical, or other professional advice. In addition, no part of this site—including articles or product references—constitutes a solicitation, recommendation, endorsement, advertisement, or offer to buy or sell any securities, franchises, or other financial instruments, particularly in jurisdictions where such activity would be unlawful.
All content is of a general nature and may not address the specific circumstances of any individual or entity. It is not a substitute for professional advice or services. Any actions you take based on the information provided here are strictly at your own risk. You accept full responsibility for any decisions or outcomes arising from your use of this website and agree to release us from any liability in connection with your use of, or reliance upon, the content or products found herein.