
|
Jerónimo Martins, SGPS, S.A. (JMT.LS) DCF Avaliação |
Totalmente Editável: Adapte-Se Às Suas Necessidades No Excel Ou Planilhas
Design Profissional: Modelos Confiáveis E Padrão Da Indústria
Pré-Construídos Para Uso Rápido E Eficiente
Compatível com MAC/PC, totalmente desbloqueado
Não É Necessária Experiência; Fácil De Seguir
Jerónimo Martins, SGPS, S.A. (JMT.LS) Bundle
Simplifique sua análise e melhore a precisão com a nossa calculadora DCF (JMTLS)! Utilizando dados Jerónimo Martins em tempo real e suposições personalizáveis, essa ferramenta permite prever, avaliar e avaliar (JMTLs) como um investidor experiente.
What You Will Receive
- Pre-Filled Financial Model: Jerónimo Martins' actual data allows for an accurate DCF valuation.
- Comprehensive Forecast Control: Modify revenue growth, profit margins, WACC, and other essential variables.
- Real-Time Calculations: Automatic updates guarantee you see changes in results instantly.
- Investor-Ready Template: A polished Excel file crafted for professional-level valuation.
- Customizable and Reusable: Designed for adaptability, making it suitable for multiple detailed forecasts.
Key Features
- Comprehensive DCF Analysis Tool: Features both unlevered and levered DCF valuation models tailored for Jerónimo Martins, SGPS, S.A. (JMTLS).
- WACC Calculator: Pre-configured Weighted Average Cost of Capital sheet with adjustable parameters specific to JMTLS.
- Customizable Forecast Assumptions: Easily adjust growth rates, capital expenditures, and discount rates for accurate projections.
- Integrated Financial Ratios: Evaluate profitability, leverage, and efficiency ratios relevant to Jerónimo Martins, SGPS, S.A. (JMTLS).
- Interactive Dashboard and Visualizations: Graphical representations of key valuation metrics for streamlined analysis.
How It Works
- Step 1: Download the Excel file for Jerónimo Martins, SGPS, S.A. (JMTLS).
- Step 2: Review the pre-filled financial data and forecasts specific to Jerónimo Martins.
- Step 3: Adjust key inputs such as revenue growth, WACC, and tax rates (highlighted cells).
- Step 4: Observe the DCF model update in real-time as you modify your assumptions.
- Step 5: Analyze the outputs to inform your investment decisions regarding Jerónimo Martins, SGPS, S.A. (JMTLS).
Why Choose This Calculator for Jerónimo Martins (JMTLS)?
- Designed for Experts: A sophisticated tool favored by analysts, CFOs, and financial consultants.
- Accurate Financial Data: Includes Jerónimo Martins' historical and projected financials for precise analysis.
- Flexible Scenario Analysis: Effortlessly test various forecasts and scenarios.
- Comprehensive Results: Automatically computes intrinsic value, NPV, and essential financial metrics.
- User-Friendly: Detailed step-by-step instructions to help you navigate the calculator with ease.
Who Can Benefit from Jerónimo Martins, SGPS, S.A. (JMTLS)?
- Investors: Enhance your investment strategies with insights from a robust market leader.
- Financial Analysts: Streamline your analysis processes by leveraging JMTLS's comprehensive financial reports.
- Consultants: Efficiently tailor your findings based on JMTLS's performance metrics for client engagements.
- Finance Enthusiasts: Expand your knowledge of the retail sector through JMTLS's real-world financial practices.
- Educators and Students: Utilize JMTLS as a case study in finance and business courses for practical learning.
What the Template Contains
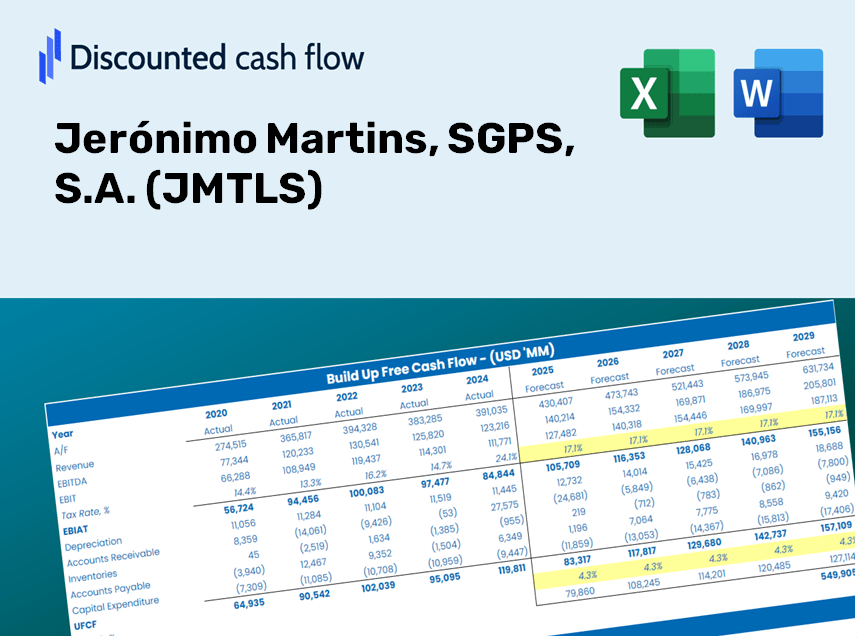
- Operating and Balance Sheet Data: Pre-filled Jerónimo Martins historical data and forecasts, including revenue, EBITDA, EBIT, and capital expenditures.
- WACC Calculation: A dedicated sheet for Weighted Average Cost of Capital (WACC), featuring parameters such as Beta, risk-free rate, and share price.
- DCF Valuation (Unlevered and Levered): Customizable Discounted Cash Flow models demonstrating intrinsic value with comprehensive calculations.
- Financial Statements: Pre-loaded financial statements (annual and quarterly) to facilitate analysis.
- Key Ratios: Includes profitability, leverage, and efficiency ratios for Jerónimo Martins (JMTLS).
- Dashboard and Charts: Visual overview of valuation outputs and assumptions for easy analysis of results.
Disclaimer
All information, articles, and product details provided on this website are for general informational and educational purposes only. We do not claim any ownership over, nor do we intend to infringe upon, any trademarks, copyrights, logos, brand names, or other intellectual property mentioned or depicted on this site. Such intellectual property remains the property of its respective owners, and any references here are made solely for identification or informational purposes, without implying any affiliation, endorsement, or partnership.
We make no representations or warranties, express or implied, regarding the accuracy, completeness, or suitability of any content or products presented. Nothing on this website should be construed as legal, tax, investment, financial, medical, or other professional advice. In addition, no part of this site—including articles or product references—constitutes a solicitation, recommendation, endorsement, advertisement, or offer to buy or sell any securities, franchises, or other financial instruments, particularly in jurisdictions where such activity would be unlawful.
All content is of a general nature and may not address the specific circumstances of any individual or entity. It is not a substitute for professional advice or services. Any actions you take based on the information provided here are strictly at your own risk. You accept full responsibility for any decisions or outcomes arising from your use of this website and agree to release us from any liability in connection with your use of, or reliance upon, the content or products found herein.