
|
Carmax, Inc. (KMX) Avaliação DCF |
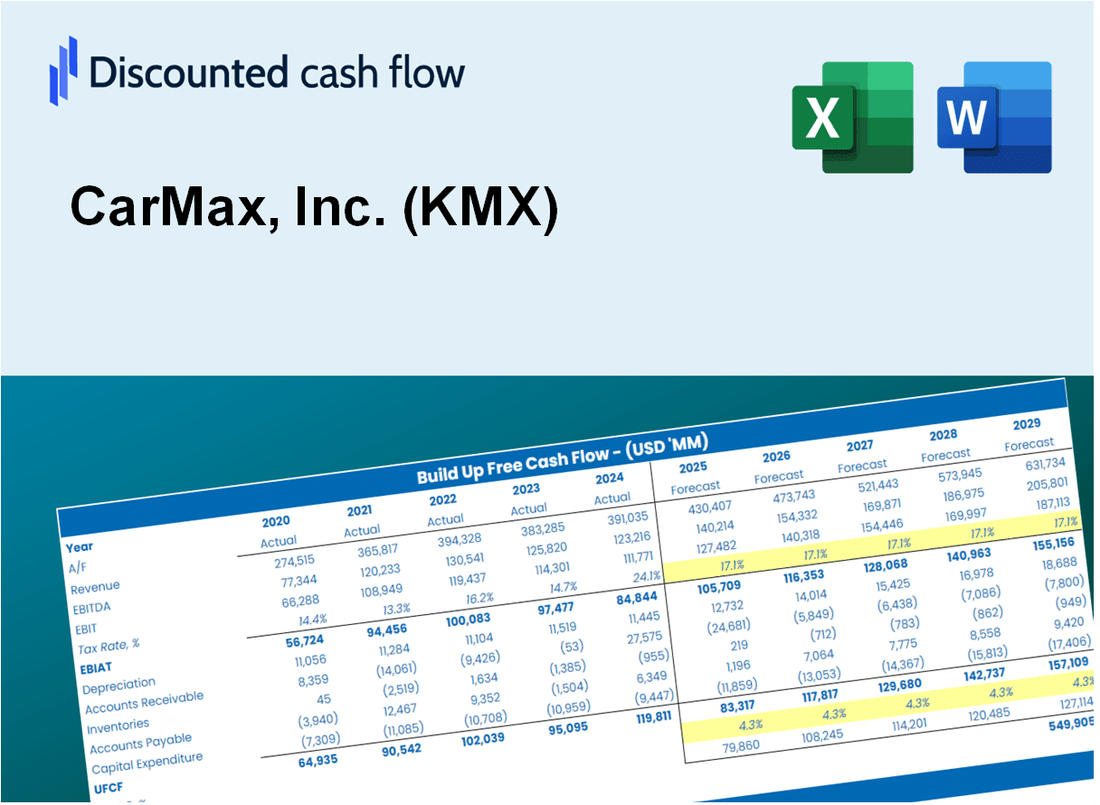
Totalmente Editável: Adapte-Se Às Suas Necessidades No Excel Ou Planilhas
Design Profissional: Modelos Confiáveis E Padrão Da Indústria
Pré-Construídos Para Uso Rápido E Eficiente
Compatível com MAC/PC, totalmente desbloqueado
Não É Necessária Experiência; Fácil De Seguir
CarMax, Inc. (KMX) Bundle
Aprimore suas estratégias de investimento com a Calculadora DCF da Carmax, Inc. (KMX)! Explore dados financeiros reais para Carmax, ajuste as projeções e despesas de crescimento e observe instantaneamente como essas modificações afetam o valor intrínseco da Carmax, Inc. (KMX).
Discounted Cash Flow (DCF) - (USD MM)
| Year | AY1 2021 |
AY2 2022 |
AY3 2023 |
AY4 2024 |
AY5 2025 |
FY1 2026 |
FY2 2027 |
FY3 2028 |
FY4 2029 |
FY5 2030 |
|---|---|---|---|---|---|---|---|---|---|---|
| Revenue | 18,950.1 | 31,900.4 | 29,684.9 | 26,536.0 | 26,353.4 | 29,654.0 | 33,368.0 | 37,547.2 | 42,249.7 | 47,541.3 |
| Revenue Growth, % | 0 | 68.34 | -6.95 | -10.61 | -0.6882 | 12.52 | 12.52 | 12.52 | 12.52 | 12.52 |
| EBITDA | 1,285.3 | 2,088.4 | 1,022.4 | 1,043.1 | 1,072.1 | 1,469.2 | 1,653.2 | 1,860.3 | 2,093.3 | 2,355.5 |
| EBITDA, % | 6.78 | 6.55 | 3.44 | 3.93 | 4.07 | 4.95 | 4.95 | 4.95 | 4.95 | 4.95 |
| Depreciation | 242.2 | 273.2 | 265.2 | 276.8 | 294.8 | 307.8 | 346.3 | 389.7 | 438.5 | 493.4 |
| Depreciation, % | 1.28 | 0.85638 | 0.89347 | 1.04 | 1.12 | 1.04 | 1.04 | 1.04 | 1.04 | 1.04 |
| EBIT | 1,043.2 | 1,815.2 | 757.2 | 766.3 | 777.3 | 1,161.5 | 1,306.9 | 1,470.6 | 1,654.8 | 1,862.0 |
| EBIT, % | 5.5 | 5.69 | 2.55 | 2.89 | 2.95 | 3.92 | 3.92 | 3.92 | 3.92 | 3.92 |
| Total Cash | 132.3 | 102.7 | 314.8 | 574.1 | 247.0 | 307.3 | 345.8 | 389.1 | 437.8 | 492.7 |
| Total Cash, percent | .0 | .0 | .0 | .0 | .0 | .0 | .0 | .0 | .0 | .0 |
| Account Receivables | 239.1 | 561.0 | 298.8 | 221.2 | 188.7 | 330.7 | 372.1 | 418.7 | 471.2 | 530.2 |
| Account Receivables, % | 1.26 | 1.76 | 1.01 | 0.83341 | 0.71616 | 1.12 | 1.12 | 1.12 | 1.12 | 1.12 |
| Inventories | 3,157.2 | 5,124.6 | 3,726.1 | 3,678.1 | 3,934.6 | 4,392.8 | 4,943.0 | 5,562.1 | 6,258.7 | 7,042.6 |
| Inventories, % | 16.66 | 16.06 | 12.55 | 13.86 | 14.93 | 14.81 | 14.81 | 14.81 | 14.81 | 14.81 |
| Accounts Payable | 799.3 | 937.7 | 826.6 | 933.7 | 977.8 | 1,018.4 | 1,145.9 | 1,289.5 | 1,451.0 | 1,632.7 |
| Accounts Payable, % | 4.22 | 2.94 | 2.78 | 3.52 | 3.71 | 3.43 | 3.43 | 3.43 | 3.43 | 3.43 |
| Capital Expenditure | -164.5 | -308.5 | -422.7 | -465.3 | -467.9 | -402.6 | -453.0 | -509.8 | -573.6 | -645.5 |
| Capital Expenditure, % | -0.86826 | -0.96718 | -1.42 | -1.75 | -1.78 | -1.36 | -1.36 | -1.36 | -1.36 | -1.36 |
| Tax Rate, % | 25.22 | 25.22 | 25.22 | 25.22 | 25.22 | 25.22 | 25.22 | 25.22 | 25.22 | 25.22 |
| EBITAT | 807.2 | 1,400.4 | 576.4 | 572.4 | 581.3 | 883.0 | 993.6 | 1,118.0 | 1,258.0 | 1,415.6 |
| Depreciation | ||||||||||
| Changes in Account Receivables | ||||||||||
| Changes in Inventories | ||||||||||
| Changes in Accounts Payable | ||||||||||
| Capital Expenditure | ||||||||||
| UFCF | -1,712.1 | -785.9 | 1,968.4 | 616.7 | 228.1 | 228.5 | 422.8 | 475.8 | 535.4 | 602.4 |
| WACC, % | 4.39 | 4.39 | 4.36 | 4.31 | 4.32 | 4.35 | 4.35 | 4.35 | 4.35 | 4.35 |
| PV UFCF | ||||||||||
| SUM PV UFCF | 1,964.2 | |||||||||
| Long Term Growth Rate, % | 2.00 | |||||||||
| Free cash flow (T + 1) | 614 | |||||||||
| Terminal Value | 26,105 | |||||||||
| Present Terminal Value | 21,095 | |||||||||
| Enterprise Value | 23,059 | |||||||||
| Net Debt | 19,179 | |||||||||
| Equity Value | 3,880 | |||||||||
| Diluted Shares Outstanding, MM | 156 | |||||||||
| Equity Value Per Share | 24.86 |
What You Will Get
- Editable Forecast Inputs: Easily modify assumptions (growth %, margins, WACC) to generate various scenarios.
- Real-World Data: CarMax’s financial data pre-filled to kickstart your analysis.
- Automatic DCF Outputs: The template computes Net Present Value (NPV) and intrinsic value for you.
- Customizable and Professional: A sleek Excel model that adjusts to your valuation requirements.
- Built for Analysts and Investors: Perfect for evaluating projections, confirming strategies, and saving time.
Key Features
- Comprehensive KMX Data: Pre-loaded with CarMax’s historical performance metrics and future growth estimates.
- Fully Customizable Inputs: Tailor revenue growth rates, profit margins, WACC, tax implications, and capital investments.
- Dynamic Valuation Model: Automatic recalculations of Net Present Value (NPV) and intrinsic value based on your parameters.
- Scenario Analysis: Develop various forecasting scenarios to evaluate different valuation results.
- User-Friendly Interface: Intuitive, organized, and suitable for both experienced analysts and newcomers.
How It Works
- Step 1: Download the Excel file.
- Step 2: Review pre-entered CarMax, Inc. (KMX) data (historical and projected).
- Step 3: Adjust key assumptions (yellow cells) based on your analysis.
- Step 4: View automatic recalculations for CarMax, Inc. (KMX)’s intrinsic value.
- Step 5: Use the outputs for investment decisions or reporting.
Why Choose This Calculator for CarMax, Inc. (KMX)?
- Designed for Industry Experts: A sophisticated tool utilized by financial analysts, CFOs, and automotive consultants.
- Accurate Financial Data: CarMax’s historical and projected financials preloaded for precise analysis.
- Flexible Scenario Analysis: Easily simulate various forecasts and assumptions to assess different outcomes.
- Comprehensive Outputs: Automatically computes intrinsic value, NPV, and essential financial metrics.
- User-Friendly Interface: Step-by-step guidance ensures a smooth navigation through the calculation process.
Who Should Use CarMax, Inc. (KMX)?
- Car Buyers: Gain confidence in your purchase with transparent pricing and quality assurance.
- Automotive Enthusiasts: Explore a wide selection of vehicles and stay informed about market trends.
- Dealership Professionals: Streamline your sales process with user-friendly tools and resources.
- Investors: Analyze the automotive retail market and make informed investment decisions.
- Students and Educators: Utilize CarMax's business model as a case study in automotive and retail courses.
What the Template Contains
- Preloaded KMX Data: Historical and projected financial data, including revenue, EBIT, and capital expenditures.
- DCF and WACC Models: Professional-grade sheets for calculating intrinsic value and Weighted Average Cost of Capital.
- Editable Inputs: Yellow-highlighted cells for adjusting revenue growth, tax rates, and discount rates.
- Financial Statements: Comprehensive annual and quarterly financials for deeper analysis.
- Key Ratios: Profitability, leverage, and efficiency ratios to evaluate performance.
- Dashboard and Charts: Visual summaries of valuation outcomes and assumptions.
Disclaimer
All information, articles, and product details provided on this website are for general informational and educational purposes only. We do not claim any ownership over, nor do we intend to infringe upon, any trademarks, copyrights, logos, brand names, or other intellectual property mentioned or depicted on this site. Such intellectual property remains the property of its respective owners, and any references here are made solely for identification or informational purposes, without implying any affiliation, endorsement, or partnership.
We make no representations or warranties, express or implied, regarding the accuracy, completeness, or suitability of any content or products presented. Nothing on this website should be construed as legal, tax, investment, financial, medical, or other professional advice. In addition, no part of this site—including articles or product references—constitutes a solicitation, recommendation, endorsement, advertisement, or offer to buy or sell any securities, franchises, or other financial instruments, particularly in jurisdictions where such activity would be unlawful.
All content is of a general nature and may not address the specific circumstances of any individual or entity. It is not a substitute for professional advice or services. Any actions you take based on the information provided here are strictly at your own risk. You accept full responsibility for any decisions or outcomes arising from your use of this website and agree to release us from any liability in connection with your use of, or reliance upon, the content or products found herein.