
|
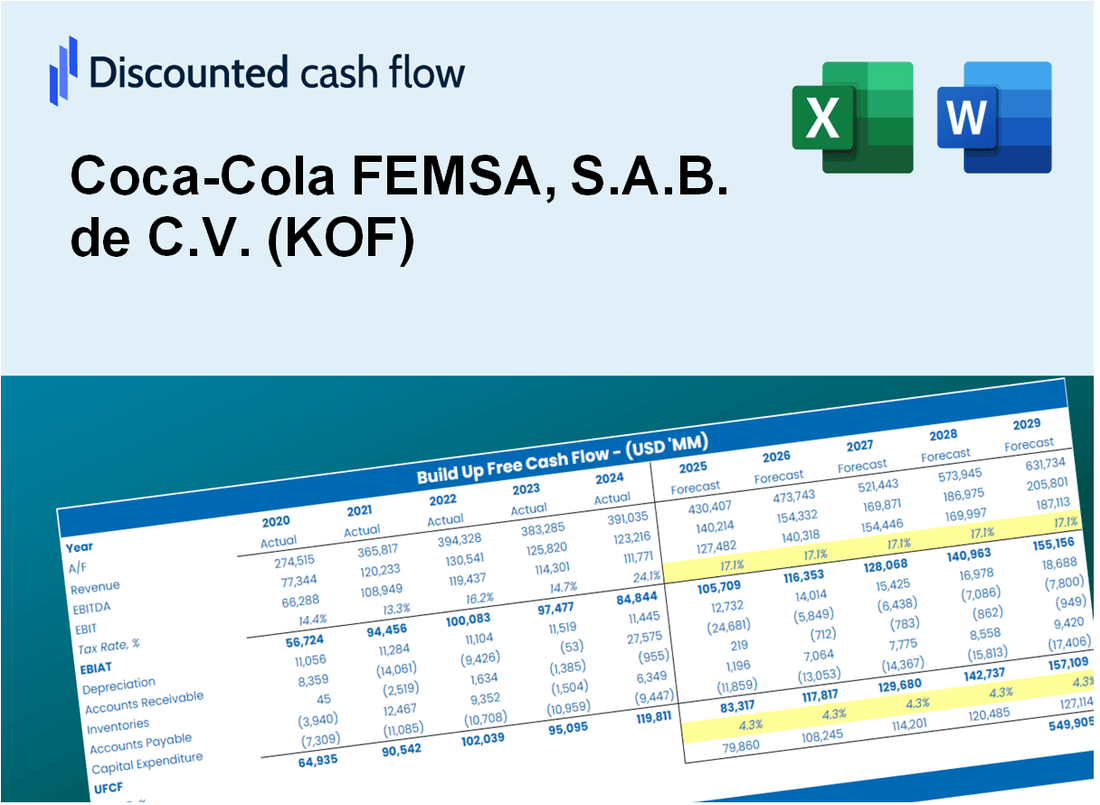
Coca-Cola Femsa, S.A.B. de C.V. (KOF) Avaliação DCF |
Totalmente Editável: Adapte-Se Às Suas Necessidades No Excel Ou Planilhas
Design Profissional: Modelos Confiáveis E Padrão Da Indústria
Pré-Construídos Para Uso Rápido E Eficiente
Compatível com MAC/PC, totalmente desbloqueado
Não É Necessária Experiência; Fácil De Seguir
Coca-Cola FEMSA, S.A.B. de C.V. (KOF) Bundle
Simplifique sua análise e melhore a precisão com a nossa calculadora DCF (KOF)! Utilizando dados reais da Coca-Cola Femsa, S.A.B. de C.V. E entradas personalizáveis, essa ferramenta capacita você a prever, analisar e valorizar (KOF) como um investidor experiente.
What You Will Get
- Pre-Filled Financial Model: Coca-Cola FEMSA’s actual data enables precise DCF valuation.
- Full Forecast Control: Adjust revenue growth, margins, WACC, and other key drivers.
- Instant Calculations: Automatic updates ensure you see results as you make changes.
- Investor-Ready Template: A refined Excel file designed for professional-grade valuation.
- Customizable and Reusable: Tailored for flexibility, allowing repeated use for detailed forecasts.
Key Features
- Comprehensive Financial Data: Access reliable pre-loaded historical figures and future forecasts for Coca-Cola FEMSA (KOF).
- Adjustable Forecast Parameters: Modify the highlighted cells for key inputs like WACC, growth rates, and profit margins.
- Real-Time Calculations: Automatic recalculations for DCF, Net Present Value (NPV), and cash flow assessments.
- Interactive Dashboard: User-friendly charts and summaries to effectively illustrate your valuation findings.
- Suitable for All Skill Levels: An intuitive layout designed for investors, CFOs, and consultants alike.
How It Works
- Download the Template: Get instant access to the Excel-based KOF DCF Calculator.
- Input Your Assumptions: Adjust yellow-highlighted cells for growth rates, WACC, margins, and more.
- Instant Calculations: The model automatically updates Coca-Cola FEMSA’s intrinsic value.
- Test Scenarios: Simulate different assumptions to evaluate potential valuation changes.
- Analyze and Decide: Use the results to guide your investment or financial analysis.
Why Choose This Calculator for Coca-Cola FEMSA (KOF)?
- Accurate Data: Access to real Coca-Cola FEMSA financials provides trustworthy valuation outcomes.
- Customizable: Tailor essential parameters such as growth rates, WACC, and tax rates to align with your forecasts.
- Time-Saving: Built-in calculations streamline the process, allowing you to avoid starting from scratch.
- Professional-Grade Tool: Crafted for investors, analysts, and consultants focused on Coca-Cola FEMSA.
- User-Friendly: An intuitive design and clear instructions make it accessible for all users.
Who Should Use Coca-Cola FEMSA, S.A.B. de C.V. (KOF)?
- Investors: Make informed investment choices with insights from a leading beverage company.
- Financial Analysts: Utilize comprehensive financial reports to enhance your market analysis.
- Consultants: Tailor strategies based on Coca-Cola FEMSA's market positioning for client engagements.
- Business Enthusiasts: Explore the dynamics of the beverage industry through Coca-Cola FEMSA's performance metrics.
- Educators and Students: Leverage case studies from Coca-Cola FEMSA to enrich finance and business curricula.
What the Template Contains
- Historical Data: Includes Coca-Cola FEMSA’s past financials and baseline forecasts.
- DCF and Levered DCF Models: Detailed templates to calculate Coca-Cola FEMSA’s intrinsic value.
- WACC Sheet: Pre-built calculations for Weighted Average Cost of Capital.
- Editable Inputs: Modify key drivers like growth rates, EBITDA %, and CAPEX assumptions.
- Quarterly and Annual Statements: A complete breakdown of Coca-Cola FEMSA’s financials.
- Interactive Dashboard: Visualize valuation results and projections dynamically.
Disclaimer
All information, articles, and product details provided on this website are for general informational and educational purposes only. We do not claim any ownership over, nor do we intend to infringe upon, any trademarks, copyrights, logos, brand names, or other intellectual property mentioned or depicted on this site. Such intellectual property remains the property of its respective owners, and any references here are made solely for identification or informational purposes, without implying any affiliation, endorsement, or partnership.
We make no representations or warranties, express or implied, regarding the accuracy, completeness, or suitability of any content or products presented. Nothing on this website should be construed as legal, tax, investment, financial, medical, or other professional advice. In addition, no part of this site—including articles or product references—constitutes a solicitation, recommendation, endorsement, advertisement, or offer to buy or sell any securities, franchises, or other financial instruments, particularly in jurisdictions where such activity would be unlawful.
All content is of a general nature and may not address the specific circumstances of any individual or entity. It is not a substitute for professional advice or services. Any actions you take based on the information provided here are strictly at your own risk. You accept full responsibility for any decisions or outcomes arising from your use of this website and agree to release us from any liability in connection with your use of, or reliance upon, the content or products found herein.