
|
Jurídico & GRUPO GERAL PLC (LGEN.L) Avaliação DCF |
Totalmente Editável: Adapte-Se Às Suas Necessidades No Excel Ou Planilhas
Design Profissional: Modelos Confiáveis E Padrão Da Indústria
Pré-Construídos Para Uso Rápido E Eficiente
Compatível com MAC/PC, totalmente desbloqueado
Não É Necessária Experiência; Fácil De Seguir
Legal & General Group Plc (LGEN.L) Bundle
Projetado para precisão, nossa calculadora DCF (LGENL) capacita você a avaliar & Avaliação do Geral Group PLC usando dados financeiros do mundo real, oferecendo flexibilidade completa para modificar todos os parâmetros essenciais para obter projeções aprimoradas.
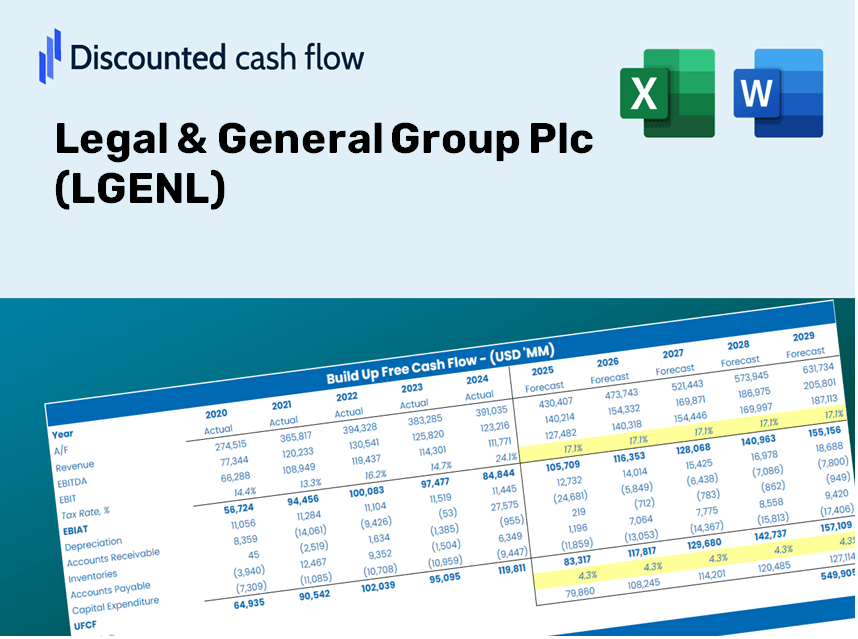
Discounted Cash Flow (DCF) - (USD MM)
| Year | AY1 2020 |
AY2 2021 |
AY3 2022 |
AY4 2023 |
AY5 2024 |
FY1 2025 |
FY2 2026 |
FY3 2027 |
FY4 2028 |
FY5 2029 |
|---|---|---|---|---|---|---|---|---|---|---|
| Revenue | 9,283.0 | 9,285.0 | 10,193.0 | 11,068.0 | 12,964.0 | 14,115.1 | 15,368.3 | 16,732.9 | 18,218.5 | 19,836.1 |
| Revenue Growth, % | 0 | 0.02154476 | 9.78 | 8.58 | 17.13 | 8.88 | 8.88 | 8.88 | 8.88 | 8.88 |
| EBITDA | 1,503.0 | 2,924.0 | 1,261.0 | 423.0 | 704.0 | 1,956.5 | 2,130.2 | 2,319.4 | 2,525.3 | 2,749.5 |
| EBITDA, % | 16.19 | 31.49 | 12.37 | 3.82 | 5.43 | 13.86 | 13.86 | 13.86 | 13.86 | 13.86 |
| Depreciation | 73.0 | 142.0 | 103.0 | .0 | .0 | 93.9 | 102.2 | 111.3 | 121.2 | 132.0 |
| Depreciation, % | 0.78638 | 1.53 | 1.01 | 0 | 0 | 0.66525 | 0.66525 | 0.66525 | 0.66525 | 0.66525 |
| EBIT | 1,430.0 | 2,782.0 | 1,158.0 | 423.0 | 704.0 | 1,862.6 | 2,028.0 | 2,208.1 | 2,404.1 | 2,617.6 |
| EBIT, % | 15.4 | 29.96 | 11.36 | 3.82 | 5.43 | 13.2 | 13.2 | 13.2 | 13.2 | 13.2 |
| Total Cash | 43,294.0 | 16,487.0 | 36,263.0 | 22,535.0 | 18,579.0 | 14,115.1 | 15,368.3 | 16,732.9 | 18,218.5 | 19,836.1 |
| Total Cash, percent | .0 | .0 | .0 | .0 | .0 | .0 | .0 | .0 | .0 | .0 |
| Account Receivables | -20,199.0 | 5,801.0 | 10,839.0 | .0 | 7,041.0 | 3,297.0 | 3,589.7 | 3,908.4 | 4,255.5 | 4,633.3 |
| Account Receivables, % | -217.59 | 62.48 | 106.34 | 0 | 54.31 | 23.36 | 23.36 | 23.36 | 23.36 | 23.36 |
| Inventories | 2,179.0 | 2,044.0 | 1,973.0 | .0 | 531.0 | 1,946.2 | 2,119.0 | 2,307.1 | 2,512.0 | 2,735.0 |
| Inventories, % | 23.47 | 22.01 | 19.36 | 0 | 4.1 | 13.79 | 13.79 | 13.79 | 13.79 | 13.79 |
| Accounts Payable | 61.0 | 73,858.0 | .0 | .0 | .0 | 2,841.6 | 3,093.9 | 3,368.6 | 3,667.7 | 3,993.3 |
| Accounts Payable, % | 0.65712 | 795.46 | 0 | 0 | 0 | 20.13 | 20.13 | 20.13 | 20.13 | 20.13 |
| Capital Expenditure | -164.0 | -205.0 | -187.0 | -237.0 | -95.0 | -245.1 | -266.9 | -290.6 | -316.4 | -344.5 |
| Capital Expenditure, % | -1.77 | -2.21 | -1.83 | -2.14 | -0.7328 | -1.74 | -1.74 | -1.74 | -1.74 | -1.74 |
| Tax Rate, % | 42.47 | 42.47 | 42.47 | 42.47 | 42.47 | 42.47 | 42.47 | 42.47 | 42.47 | 42.47 |
| EBITAT | 1,607.0 | 2,292.2 | 1,044.6 | 2,543.6 | 405.0 | 1,602.3 | 1,744.6 | 1,899.5 | 2,068.2 | 2,251.8 |
| Depreciation | ||||||||||
| Changes in Account Receivables | ||||||||||
| Changes in Inventories | ||||||||||
| Changes in Accounts Payable | ||||||||||
| Capital Expenditure | ||||||||||
| UFCF | 19,597.0 | 50,161.2 | -77,864.4 | 15,118.6 | -7,262.0 | 6,621.5 | 1,366.7 | 1,488.1 | 1,620.2 | 1,764.1 |
| WACC, % | 7.55 | 7.25 | 7.38 | 7.55 | 6.82 | 7.31 | 7.31 | 7.31 | 7.31 | 7.31 |
| PV UFCF | ||||||||||
| SUM PV UFCF | 11,023.3 | |||||||||
| Long Term Growth Rate, % | 2.00 | |||||||||
| Free cash flow (T + 1) | 1,799 | |||||||||
| Terminal Value | 33,893 | |||||||||
| Present Terminal Value | 23,819 | |||||||||
| Enterprise Value | 34,843 | |||||||||
| Net Debt | -8,958 | |||||||||
| Equity Value | 43,801 | |||||||||
| Diluted Shares Outstanding, MM | 5,948 | |||||||||
| Equity Value Per Share | 736.39 |
What You Will Receive
- Authentic LGENL Financials: Provides historical and projected data for precise valuation.
- Customizable Inputs: Adjust WACC, tax rates, revenue growth, and capital expenditures as needed.
- Automated Calculations: Automatically computes intrinsic value and NPV in real-time.
- Scenario Analysis: Explore various scenarios to assess the future performance of Legal & General Group Plc.
- User-Friendly Design: Designed for industry professionals while remaining accessible for newcomers.
Key Features
- Comprehensive DCF Calculator: Offers detailed unlevered and levered DCF valuation models tailored for Legal & General Group Plc (LGENL).
- WACC Calculator: Pre-designed Weighted Average Cost of Capital sheet with adjustable inputs specific to LGENL.
- Customizable Forecast Assumptions: Alter growth rates, capital expenditures, and discount rates to suit LGENL's financial outlook.
- Integrated Financial Ratios: Evaluate profitability, leverage, and efficiency ratios pertinent to Legal & General Group Plc (LGENL).
- Interactive Dashboard and Charts: Visual representations provide a summary of key valuation metrics for straightforward analysis of LGENL.
How It Functions
- Download: Obtain the pre-filled Excel file featuring Legal & General Group Plc’s (LGENL) financial data.
- Customize: Modify key metrics such as revenue growth, EBITDA margin, and WACC as needed.
- Auto-Update: Watch as the intrinsic value and NPV calculations refresh in real-time.
- Scenario Testing: Develop various forecasts and instantly analyze the resulting outcomes.
- Make Informed Choices: Utilize the valuation insights to inform your investment decisions.
Why Select Legal & General Group Plc (LGENL) Calculator?
- Time Efficient: Skip the hassle of building a DCF model from the ground up – it’s ready for immediate use.
- Enhanced Accuracy: Dependable financial data and formulas help minimize valuation errors.
- Completely Customizable: Adjust the model to align with your specific assumptions and forecasts.
- User-Friendly: Intuitive charts and outputs make understanding results straightforward.
- Endorsed by Experts: Crafted for professionals who prioritize accuracy and ease of use.
Who Can Benefit from Legal & General Group Plc (LGENL)?
- Investors: Equip yourself with a professional-grade valuation tool to make informed investment decisions.
- Financial Analysts: Boost your efficiency with a customizable DCF model designed for quick application.
- Consultants: Effortlessly modify the template for client presentations or reports.
- Finance Enthusiasts: Enhance your knowledge of valuation methods through practical, real-world examples.
- Educators and Students: Utilize this tool as a valuable resource in finance-focused academic courses.
Contents of the Template
- Pre-Filled DCF Model: Legal & General Group Plc’s financial data preloaded for immediate application.
- WACC Calculator: Comprehensive calculations for Weighted Average Cost of Capital.
- Financial Ratios: Assess Legal & General Group Plc’s profitability, leverage, and efficiency metrics.
- Editable Inputs: Adjust key assumptions like growth rates, margins, and CAPEX to tailor your analysis.
- Financial Statements: Access annual and quarterly reports for thorough evaluation.
- Interactive Dashboard: Effortlessly visualize essential valuation metrics and findings.
Disclaimer
All information, articles, and product details provided on this website are for general informational and educational purposes only. We do not claim any ownership over, nor do we intend to infringe upon, any trademarks, copyrights, logos, brand names, or other intellectual property mentioned or depicted on this site. Such intellectual property remains the property of its respective owners, and any references here are made solely for identification or informational purposes, without implying any affiliation, endorsement, or partnership.
We make no representations or warranties, express or implied, regarding the accuracy, completeness, or suitability of any content or products presented. Nothing on this website should be construed as legal, tax, investment, financial, medical, or other professional advice. In addition, no part of this site—including articles or product references—constitutes a solicitation, recommendation, endorsement, advertisement, or offer to buy or sell any securities, franchises, or other financial instruments, particularly in jurisdictions where such activity would be unlawful.
All content is of a general nature and may not address the specific circumstances of any individual or entity. It is not a substitute for professional advice or services. Any actions you take based on the information provided here are strictly at your own risk. You accept full responsibility for any decisions or outcomes arising from your use of this website and agree to release us from any liability in connection with your use of, or reliance upon, the content or products found herein.