
|
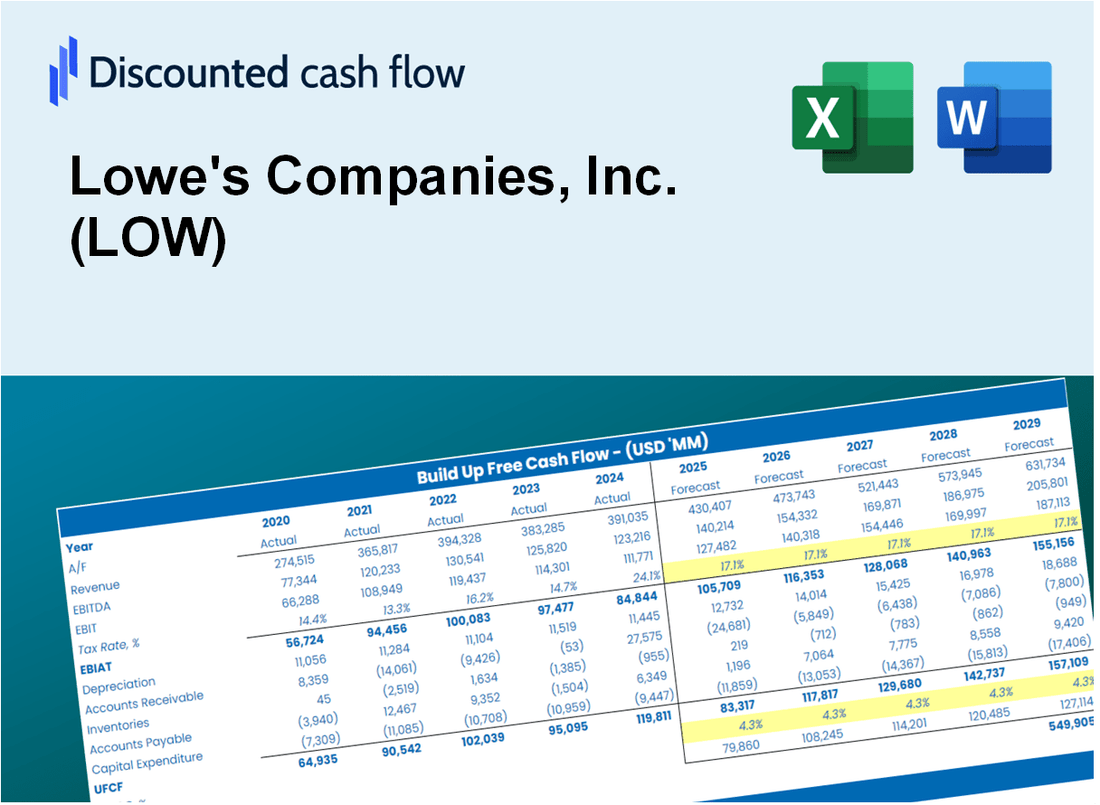
Avaliação DCF Companies, Inc. (baixa) de Lowe's Companies |
Totalmente Editável: Adapte-Se Às Suas Necessidades No Excel Ou Planilhas
Design Profissional: Modelos Confiáveis E Padrão Da Indústria
Pré-Construídos Para Uso Rápido E Eficiente
Compatível com MAC/PC, totalmente desbloqueado
Não É Necessária Experiência; Fácil De Seguir
Lowe's Companies, Inc. (LOW) Bundle
Explore Companies, Inc. (baixo) Potencial financeiro (baixo) com nossa calculadora DCF fácil de usar! Digite suas projeções de crescimento, margens e despesas para calcular o valor intrínseco da Lowe e refine sua abordagem de investimento.
Discounted Cash Flow (DCF) - (USD MM)
| Year | AY1 2020 |
AY2 2021 |
AY3 2022 |
AY4 2023 |
AY5 2024 |
FY1 2025 |
FY2 2026 |
FY3 2027 |
FY4 2028 |
FY5 2029 |
|---|---|---|---|---|---|---|---|---|---|---|
| Revenue | 89,597.0 | 96,250.0 | 97,059.0 | 86,377.0 | 83,674.0 | 82,446.3 | 81,236.6 | 80,044.7 | 78,870.2 | 77,713.0 |
| Revenue Growth, % | 0 | 7.43 | 0.84052 | -11.01 | -3.13 | -1.47 | -1.47 | -1.47 | -1.47 | -1.47 |
| EBITDA | 10,684.0 | 14,466.0 | 12,685.0 | 13,571.0 | 12,594.0 | 11,672.1 | 11,500.8 | 11,332.1 | 11,165.8 | 11,002.0 |
| EBITDA, % | 11.92 | 15.03 | 13.07 | 15.71 | 15.05 | 14.16 | 14.16 | 14.16 | 14.16 | 14.16 |
| Depreciation | 2,073.0 | 2,399.0 | 2,511.0 | 1,923.0 | 1,972.0 | 1,974.8 | 1,945.8 | 1,917.3 | 1,889.1 | 1,861.4 |
| Depreciation, % | 2.31 | 2.49 | 2.59 | 2.23 | 2.36 | 2.4 | 2.4 | 2.4 | 2.4 | 2.4 |
| EBIT | 8,611.0 | 12,067.0 | 10,174.0 | 11,648.0 | 10,622.0 | 9,697.3 | 9,555.0 | 9,414.8 | 9,276.7 | 9,140.6 |
| EBIT, % | 9.61 | 12.54 | 10.48 | 13.49 | 12.69 | 11.76 | 11.76 | 11.76 | 11.76 | 11.76 |
| Total Cash | 5,196.0 | 1,404.0 | 1,732.0 | 1,228.0 | 2,133.0 | 2,145.8 | 2,114.3 | 2,083.3 | 2,052.7 | 2,022.6 |
| Total Cash, percent | .0 | .0 | .0 | .0 | .0 | .0 | .0 | .0 | .0 | .0 |
| Account Receivables | .0 | .0 | .0 | .0 | .0 | .0 | .0 | .0 | .0 | .0 |
| Account Receivables, % | 0 | 0 | 0 | 0 | 0 | 0 | 0 | 0 | 0 | 0 |
| Inventories | 16,193.0 | 17,605.0 | 18,532.0 | 16,894.0 | 17,409.0 | 15,800.3 | 15,568.5 | 15,340.0 | 15,115.0 | 14,893.2 |
| Inventories, % | 18.07 | 18.29 | 19.09 | 19.56 | 20.81 | 19.16 | 19.16 | 19.16 | 19.16 | 19.16 |
| Accounts Payable | 10,884.0 | 11,354.0 | 10,524.0 | 8,704.0 | 9,290.0 | 9,228.4 | 9,093.0 | 8,959.6 | 8,828.2 | 8,698.6 |
| Accounts Payable, % | 12.15 | 11.8 | 10.84 | 10.08 | 11.1 | 11.19 | 11.19 | 11.19 | 11.19 | 11.19 |
| Capital Expenditure | -1,791.0 | -1,853.0 | -1,829.0 | -1,964.0 | -1,927.0 | -1,712.5 | -1,687.3 | -1,662.6 | -1,638.2 | -1,614.1 |
| Capital Expenditure, % | -2 | -1.93 | -1.88 | -2.27 | -2.3 | -2.08 | -2.08 | -2.08 | -2.08 | -2.08 |
| Tax Rate, % | 23.99 | 23.99 | 23.99 | 23.99 | 23.99 | 23.99 | 23.99 | 23.99 | 23.99 | 23.99 |
| EBITAT | 6,492.5 | 9,089.0 | 7,247.7 | 8,844.5 | 8,073.6 | 7,251.5 | 7,145.1 | 7,040.3 | 6,937.0 | 6,835.2 |
| Depreciation | ||||||||||
| Changes in Account Receivables | ||||||||||
| Changes in Inventories | ||||||||||
| Changes in Accounts Payable | ||||||||||
| Capital Expenditure | ||||||||||
| UFCF | 1,465.5 | 8,693.0 | 6,172.7 | 8,621.5 | 8,189.6 | 9,061.0 | 7,500.1 | 7,390.0 | 7,281.6 | 7,174.8 |
| WACC, % | 6.98 | 6.98 | 6.94 | 6.98 | 6.99 | 6.97 | 6.97 | 6.97 | 6.97 | 6.97 |
| PV UFCF | ||||||||||
| SUM PV UFCF | 31,742.7 | |||||||||
| Long Term Growth Rate, % | 2.00 | |||||||||
| Free cash flow (T + 1) | 7,318 | |||||||||
| Terminal Value | 147,105 | |||||||||
| Present Terminal Value | 105,007 | |||||||||
| Enterprise Value | 136,750 | |||||||||
| Net Debt | 37,917 | |||||||||
| Equity Value | 98,833 | |||||||||
| Diluted Shares Outstanding, MM | 567 | |||||||||
| Equity Value Per Share | 174.17 |
What You Will Receive
- Pre-Filled Financial Model: Lowe's actual data allows for accurate DCF valuation.
- Comprehensive Forecast Control: Modify revenue growth, profit margins, WACC, and other essential metrics.
- Real-Time Calculations: Automatic updates ensure you see outcomes instantly as adjustments are made.
- Professional-Grade Template: A polished Excel file crafted for high-quality valuation.
- Flexible and Reusable: Designed for adaptability, enabling repeated use for in-depth forecasts.
Key Features
- Accurate Lowe's Financials: Gain access to reliable pre-loaded historical data and future forecasts.
- Customizable Assumptions: Modify highlighted cells for key metrics such as WACC, growth rates, and profit margins.
- Real-Time Calculations: Automatic adjustments to DCF, Net Present Value (NPV), and cash flow assessments.
- User-Friendly Dashboard: Clear charts and summaries to effectively visualize your valuation outcomes.
- Designed for All Skill Levels: An intuitive layout tailored for investors, CFOs, and consultants alike.
How It Works
- 1. Access the Template: Download and open the Excel file featuring Lowe's preloaded data.
- 2. Modify Assumptions: Adjust critical inputs such as growth rates, WACC, and capital expenditures.
- 3. View Results in Real-Time: The DCF model automatically calculates intrinsic value and NPV.
- 4. Explore Scenarios: Analyze various forecasts to evaluate different valuation results.
- 5. Present with Assurance: Deliver professional valuation insights to inform your decisions.
Why Choose This Calculator?
- Designed for Experts: A sophisticated tool favored by financial analysts, CFOs, and industry consultants.
- Accurate Financial Data: Lowe's historical and projected financials preloaded for reliable analysis.
- Flexible Scenario Analysis: Effortlessly simulate various forecasts and assumptions.
- Comprehensive Results: Automatically computes intrinsic value, NPV, and essential financial metrics.
- User-Friendly Interface: Step-by-step guidance simplifies the calculation process.
Who Should Use This Product?
- Investors: Effectively assess Lowe's fair value before making investment choices.
- CFOs: Utilize a top-tier DCF model for financial analysis and reporting.
- Consultants: Efficiently customize the template for client valuation reports.
- Entrepreneurs: Acquire knowledge on financial modeling practices employed by leading corporations.
- Educators: Implement it as a resource to illustrate valuation techniques.
What the Template Contains
- Comprehensive DCF Model: Editable template featuring in-depth valuation calculations.
- Real-World Data: Lowe's historical and projected financials preloaded for thorough analysis.
- Customizable Parameters: Modify WACC, growth rates, and tax assumptions to explore different scenarios.
- Financial Statements: Complete annual and quarterly breakdowns for enhanced insights.
- Key Ratios: Integrated analysis for profitability, efficiency, and leverage metrics.
- Dashboard with Visual Outputs: Visualizations and tables for clear, actionable insights.
Disclaimer
All information, articles, and product details provided on this website are for general informational and educational purposes only. We do not claim any ownership over, nor do we intend to infringe upon, any trademarks, copyrights, logos, brand names, or other intellectual property mentioned or depicted on this site. Such intellectual property remains the property of its respective owners, and any references here are made solely for identification or informational purposes, without implying any affiliation, endorsement, or partnership.
We make no representations or warranties, express or implied, regarding the accuracy, completeness, or suitability of any content or products presented. Nothing on this website should be construed as legal, tax, investment, financial, medical, or other professional advice. In addition, no part of this site—including articles or product references—constitutes a solicitation, recommendation, endorsement, advertisement, or offer to buy or sell any securities, franchises, or other financial instruments, particularly in jurisdictions where such activity would be unlawful.
All content is of a general nature and may not address the specific circumstances of any individual or entity. It is not a substitute for professional advice or services. Any actions you take based on the information provided here are strictly at your own risk. You accept full responsibility for any decisions or outcomes arising from your use of this website and agree to release us from any liability in connection with your use of, or reliance upon, the content or products found herein.