
|
Avaliação DCF da LPL Financial Holdings Inc. (LPLA) |
Totalmente Editável: Adapte-Se Às Suas Necessidades No Excel Ou Planilhas
Design Profissional: Modelos Confiáveis E Padrão Da Indústria
Pré-Construídos Para Uso Rápido E Eficiente
Compatível com MAC/PC, totalmente desbloqueado
Não É Necessária Experiência; Fácil De Seguir
LPL Financial Holdings Inc. (LPLA) Bundle
Projetado para precisão, nossa calculadora LPLA DCF permite avaliar a avaliação da LPL Financial Holdings Inc. usando dados financeiros do mundo real e oferece flexibilidade completa para modificar todos os parâmetros essenciais para melhorar as projeções.
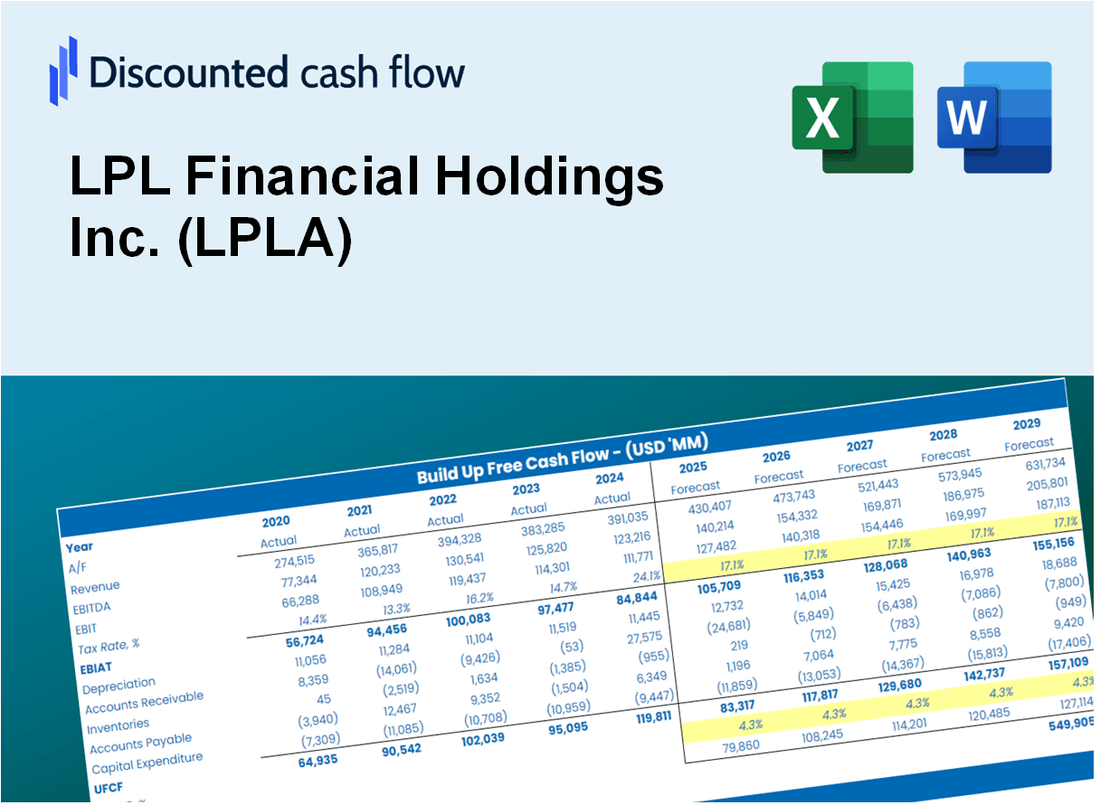
Discounted Cash Flow (DCF) - (USD MM)
| Year | AY1 2020 |
AY2 2021 |
AY3 2022 |
AY4 2023 |
AY5 2024 |
FY1 2025 |
FY2 2026 |
FY3 2027 |
FY4 2028 |
FY5 2029 |
|---|---|---|---|---|---|---|---|---|---|---|
| Revenue | 5,871.6 | 7,720.8 | 8,600.8 | 10,052.8 | 12,385.1 | 14,954.2 | 18,056.2 | 21,801.7 | 26,324.1 | 31,784.6 |
| Revenue Growth, % | 0 | 31.49 | 11.4 | 16.88 | 23.2 | 20.74 | 20.74 | 20.74 | 20.74 | 20.74 |
| EBITDA | 908.9 | 1,037.2 | 1,525.3 | 1,985.8 | 2,110.8 | 2,495.7 | 3,013.4 | 3,638.5 | 4,393.2 | 5,304.5 |
| EBITDA, % | 15.48 | 13.43 | 17.73 | 19.75 | 17.04 | 16.69 | 16.69 | 16.69 | 16.69 | 16.69 |
| Depreciation | 177.1 | 230.7 | 287.4 | 354.2 | 443.8 | 492.0 | 594.1 | 717.3 | 866.1 | 1,045.8 |
| Depreciation, % | 3.02 | 2.99 | 3.34 | 3.52 | 3.58 | 3.29 | 3.29 | 3.29 | 3.29 | 3.29 |
| EBIT | 731.8 | 806.5 | 1,237.9 | 1,631.6 | 1,667.1 | 2,003.7 | 2,419.3 | 2,921.1 | 3,527.1 | 4,258.7 |
| EBIT, % | 12.46 | 10.45 | 14.39 | 16.23 | 13.46 | 13.4 | 13.4 | 13.4 | 13.4 | 13.4 |
| Total Cash | 818.4 | 514.9 | 884.3 | 541.8 | 1,009.3 | 1,328.7 | 1,604.4 | 1,937.2 | 2,339.0 | 2,824.2 |
| Total Cash, percent | .0 | .0 | .0 | .0 | .0 | .0 | .0 | .0 | .0 | .0 |
| Account Receivables | 1,524.9 | 2,226.7 | 2,418.6 | 2,861.7 | 3,894.2 | 4,272.2 | 5,158.4 | 6,228.4 | 7,520.3 | 9,080.3 |
| Account Receivables, % | 25.97 | 28.84 | 28.12 | 28.47 | 31.44 | 28.57 | 28.57 | 28.57 | 28.57 | 28.57 |
| Inventories | .0 | .0 | .0 | .0 | .0 | .0 | .0 | .0 | .0 | .0 |
| Inventories, % | 0 | 0 | 0 | 0 | 0 | 0 | 0 | 0 | 0 | 0 |
| Accounts Payable | 1,933.4 | 2,266.4 | 3,291.3 | 2,915.5 | 2,616.3 | 4,506.5 | 5,441.2 | 6,569.9 | 7,932.8 | 9,578.3 |
| Accounts Payable, % | 32.93 | 29.35 | 38.27 | 29 | 21.12 | 30.14 | 30.14 | 30.14 | 30.14 | 30.14 |
| Capital Expenditure | -155.5 | -216.0 | -306.6 | -403.3 | -562.5 | -525.3 | -634.3 | -765.9 | -924.8 | -1,116.6 |
| Capital Expenditure, % | -2.65 | -2.8 | -3.56 | -4.01 | -4.54 | -3.51 | -3.51 | -3.51 | -3.51 | -3.51 |
| Tax Rate, % | 24 | 24 | 24 | 24 | 24 | 24 | 24 | 24 | 24 | 24 |
| EBITAT | 552.5 | 616.8 | 941.7 | 1,204.1 | 1,267.0 | 1,514.1 | 1,828.2 | 2,207.5 | 2,665.4 | 3,218.3 |
| Depreciation | ||||||||||
| Changes in Account Receivables | ||||||||||
| Changes in Inventories | ||||||||||
| Changes in Accounts Payable | ||||||||||
| Capital Expenditure | ||||||||||
| UFCF | 982.5 | 262.7 | 1,755.6 | 336.2 | -183.5 | 2,993.1 | 1,836.6 | 2,217.6 | 2,677.6 | 3,233.1 |
| WACC, % | 5.95 | 5.95 | 5.95 | 5.93 | 5.95 | 5.95 | 5.95 | 5.95 | 5.95 | 5.95 |
| PV UFCF | ||||||||||
| SUM PV UFCF | 10,873.5 | |||||||||
| Long Term Growth Rate, % | 2.00 | |||||||||
| Free cash flow (T + 1) | 3,298 | |||||||||
| Terminal Value | 83,571 | |||||||||
| Present Terminal Value | 62,608 | |||||||||
| Enterprise Value | 73,481 | |||||||||
| Net Debt | 4,780 | |||||||||
| Equity Value | 68,701 | |||||||||
| Diluted Shares Outstanding, MM | 75 | |||||||||
| Equity Value Per Share | 910.83 |
What You Will Get
- Comprehensive LPLA Financials: Access to historical and projected data for precise valuation.
- Customizable Inputs: Adjust WACC, tax rates, revenue growth, and capital expenditures as needed.
- Dynamic Calculations: Intrinsic value and NPV are computed automatically.
- Scenario Analysis: Evaluate various scenarios to assess LPL Financial's future outlook.
- User-Friendly Design: Designed for experts while remaining easy to navigate for newcomers.
Key Features
- 🔍 Real-Life LPLA Financials: Pre-filled historical and projected data for LPL Financial Holdings Inc. (LPLA).
- ✏️ Fully Customizable Inputs: Adjust all critical parameters (yellow cells) like WACC, growth %, and tax rates.
- 📊 Professional DCF Valuation: Built-in formulas calculate LPL’s intrinsic value using the Discounted Cash Flow method.
- ⚡ Instant Results: Visualize LPL’s valuation instantly after making changes.
- Scenario Analysis: Test and compare outcomes for various financial assumptions side-by-side.
How It Works
- Step 1: Download the Excel file.
- Step 2: Review pre-entered LPL Financial Holdings Inc. (LPLA) data (historical and projected).
- Step 3: Adjust key assumptions (yellow cells) based on your analysis.
- Step 4: View automatic recalculations for LPL Financial Holdings Inc. (LPLA)’s intrinsic value.
- Step 5: Use the outputs for investment decisions or reporting.
Why Choose This Calculator for LPL Financial Holdings Inc. (LPLA)?
- All-in-One Solution: Combines DCF, WACC, and financial ratio analyses tailored for LPLA.
- Adjustable Parameters: Modify yellow-highlighted cells to explore different financial scenarios.
- In-Depth Analysis: Automatically computes LPLA’s intrinsic value and Net Present Value.
- Preloaded Information: Historical and projected data provide reliable starting points for analysis.
- High-Quality Standards: Perfect for financial analysts, investors, and business advisors focused on LPLA.
Who Should Use This Product?
- Professional Investors: Develop comprehensive and accurate valuation models for LPL Financial Holdings Inc. (LPLA) portfolio assessments.
- Corporate Finance Teams: Evaluate valuation scenarios to inform strategic decisions within the organization.
- Consultants and Advisors: Deliver precise valuation insights to clients regarding LPL Financial Holdings Inc. (LPLA).
- Students and Educators: Utilize real-world data to enhance learning and practice in financial modeling.
- Finance Enthusiasts: Gain insights into how financial services firms like LPL Financial Holdings Inc. (LPLA) are valued in the market.
What the Template Contains
- Operating and Balance Sheet Data: Pre-filled LPL Financial Holdings Inc. (LPLA) historical data and forecasts, including revenue, EBITDA, EBIT, and capital expenditures.
- WACC Calculation: A dedicated sheet for Weighted Average Cost of Capital (WACC), including parameters like Beta, risk-free rate, and share price.
- DCF Valuation (Unlevered and Levered): Editable Discounted Cash Flow models showing intrinsic value with detailed calculations.
- Financial Statements: Pre-loaded financial statements (annual and quarterly) to support analysis.
- Key Ratios: Includes profitability, leverage, and efficiency ratios for LPL Financial Holdings Inc. (LPLA).
- Dashboard and Charts: Visual summary of valuation outputs and assumptions to analyze results easily.
Disclaimer
All information, articles, and product details provided on this website are for general informational and educational purposes only. We do not claim any ownership over, nor do we intend to infringe upon, any trademarks, copyrights, logos, brand names, or other intellectual property mentioned or depicted on this site. Such intellectual property remains the property of its respective owners, and any references here are made solely for identification or informational purposes, without implying any affiliation, endorsement, or partnership.
We make no representations or warranties, express or implied, regarding the accuracy, completeness, or suitability of any content or products presented. Nothing on this website should be construed as legal, tax, investment, financial, medical, or other professional advice. In addition, no part of this site—including articles or product references—constitutes a solicitation, recommendation, endorsement, advertisement, or offer to buy or sell any securities, franchises, or other financial instruments, particularly in jurisdictions where such activity would be unlawful.
All content is of a general nature and may not address the specific circumstances of any individual or entity. It is not a substitute for professional advice or services. Any actions you take based on the information provided here are strictly at your own risk. You accept full responsibility for any decisions or outcomes arising from your use of this website and agree to release us from any liability in connection with your use of, or reliance upon, the content or products found herein.