
|
Vail Resorts, Inc. (MTN) Avaliação DCF |
Totalmente Editável: Adapte-Se Às Suas Necessidades No Excel Ou Planilhas
Design Profissional: Modelos Confiáveis E Padrão Da Indústria
Pré-Construídos Para Uso Rápido E Eficiente
Compatível com MAC/PC, totalmente desbloqueado
Não É Necessária Experiência; Fácil De Seguir
Vail Resorts, Inc. (MTN) Bundle
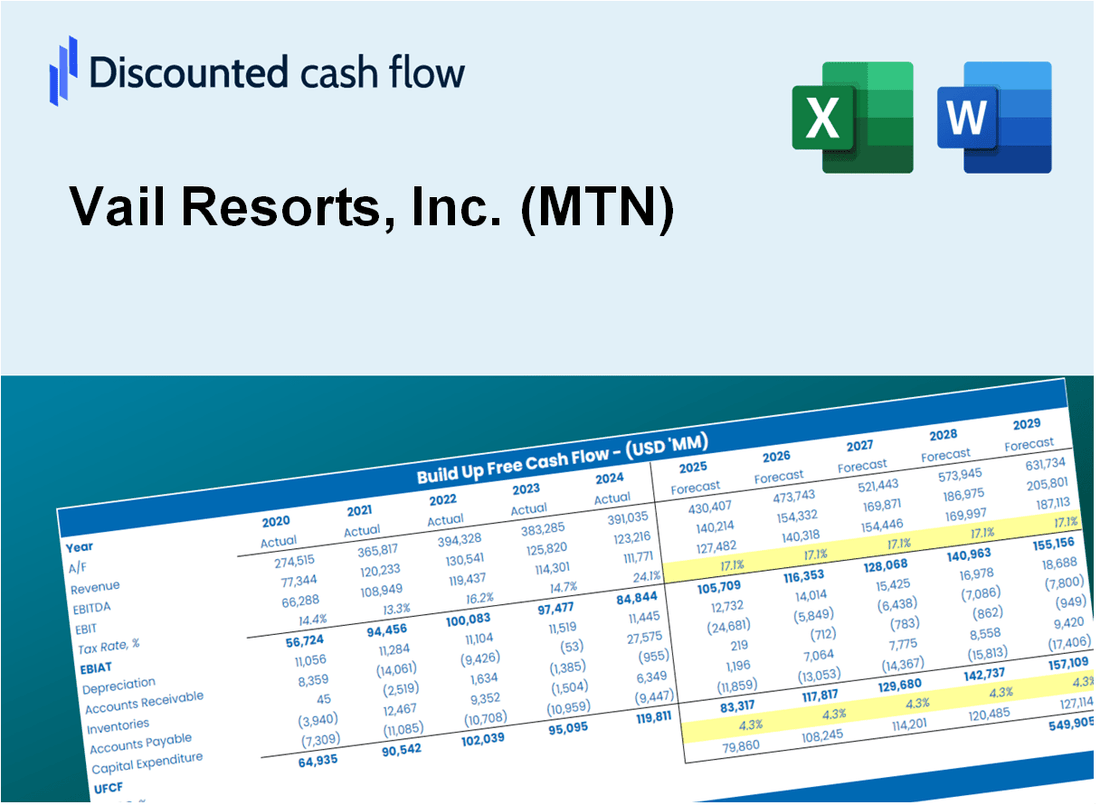
Aprimore suas estratégias de investimento com a calculadora DCF da Vail Resorts, Inc. (MTN)! Explore dados financeiros autênticos para resorts de Vail, ajuste as previsões e despesas do crescimento e observe instantaneamente como essas modificações influenciam o valor intrínseco da Vail Resorts, Inc. (MTN).
What You Will Receive
- Pre-Filled Financial Model: Vail Resorts, Inc.’s actual data facilitates accurate DCF valuation.
- Comprehensive Forecast Control: Modify revenue growth, margins, WACC, and other essential drivers.
- Immediate Calculations: Automatic updates provide real-time results as you make adjustments.
- Investor-Ready Template: A polished Excel file crafted for professional-level valuation.
- Customizable and Reusable: Designed for adaptability, enabling repeated use for in-depth forecasts.
Key Features
- Customizable Financial Inputs: Adjust essential metrics such as visitor growth, revenue per skier, and operational expenses.
- Instant DCF Valuation: Automatically computes intrinsic value, NPV, and other key financial indicators.
- High-Precision Accuracy: Leverages Vail Resorts' real-world financial data for accurate valuation results.
- Effortless Scenario Planning: Easily evaluate various assumptions and analyze different outcomes.
- Efficiency Booster: Streamline the valuation process without the hassle of creating intricate models from the ground up.
How It Works
- Download the Template: Get instant access to the Excel-based Vail Resorts DCF Calculator.
- Input Your Assumptions: Adjust yellow-highlighted cells for growth rates, WACC, margins, and more.
- Instant Calculations: The model automatically updates Vail Resorts’ intrinsic value.
- Test Scenarios: Simulate different assumptions to evaluate potential valuation changes.
- Analyze and Decide: Use the results to guide your investment or financial analysis.
Why Choose Vail Resorts, Inc. (MTN) Calculator?
- Precision: Utilizes real Vail Resorts financial data for reliable results.
- Adaptability: Tailored for users to easily adjust and test various inputs.
- Efficiency: Eliminate the need to create a financial model from the ground up.
- Expert-Level: Crafted with the accuracy and usability expected by industry professionals.
- Intuitive: Simple to navigate, even for those new to financial modeling.
Who Should Use This Product?
- Hospitality Students: Explore management strategies and apply them to real-world scenarios.
- Researchers: Integrate industry-specific models into your studies or publications.
- Investors: Evaluate your investment strategies and analyze valuation metrics for Vail Resorts, Inc. (MTN).
- Market Analysts: Enhance your analysis with a customizable financial model tailored for the hospitality sector.
- Resort Owners: Understand how major players like Vail Resorts, Inc. (MTN) are evaluated in the market.
What the Template Contains
- Comprehensive DCF Model: Editable template featuring detailed valuation calculations specific to Vail Resorts, Inc. (MTN).
- Real-World Data: Vail Resorts’ historical and projected financials preloaded for in-depth analysis.
- Customizable Parameters: Modify WACC, growth rates, and tax assumptions to explore various scenarios.
- Financial Statements: Complete annual and quarterly breakdowns for enhanced insights into performance.
- Key Ratios: Integrated analysis for profitability, efficiency, and leverage metrics.
- Dashboard with Visual Outputs: Engaging charts and tables to present clear, actionable results.
Disclaimer
All information, articles, and product details provided on this website are for general informational and educational purposes only. We do not claim any ownership over, nor do we intend to infringe upon, any trademarks, copyrights, logos, brand names, or other intellectual property mentioned or depicted on this site. Such intellectual property remains the property of its respective owners, and any references here are made solely for identification or informational purposes, without implying any affiliation, endorsement, or partnership.
We make no representations or warranties, express or implied, regarding the accuracy, completeness, or suitability of any content or products presented. Nothing on this website should be construed as legal, tax, investment, financial, medical, or other professional advice. In addition, no part of this site—including articles or product references—constitutes a solicitation, recommendation, endorsement, advertisement, or offer to buy or sell any securities, franchises, or other financial instruments, particularly in jurisdictions where such activity would be unlawful.
All content is of a general nature and may not address the specific circumstances of any individual or entity. It is not a substitute for professional advice or services. Any actions you take based on the information provided here are strictly at your own risk. You accept full responsibility for any decisions or outcomes arising from your use of this website and agree to release us from any liability in connection with your use of, or reliance upon, the content or products found herein.