
|
O Duckhorn Portfolio, Inc. (Napa) DCF Avaliação |
Totalmente Editável: Adapte-Se Às Suas Necessidades No Excel Ou Planilhas
Design Profissional: Modelos Confiáveis E Padrão Da Indústria
Pré-Construídos Para Uso Rápido E Eficiente
Compatível com MAC/PC, totalmente desbloqueado
Não É Necessária Experiência; Fácil De Seguir
The Duckhorn Portfolio, Inc. (NAPA) Bundle
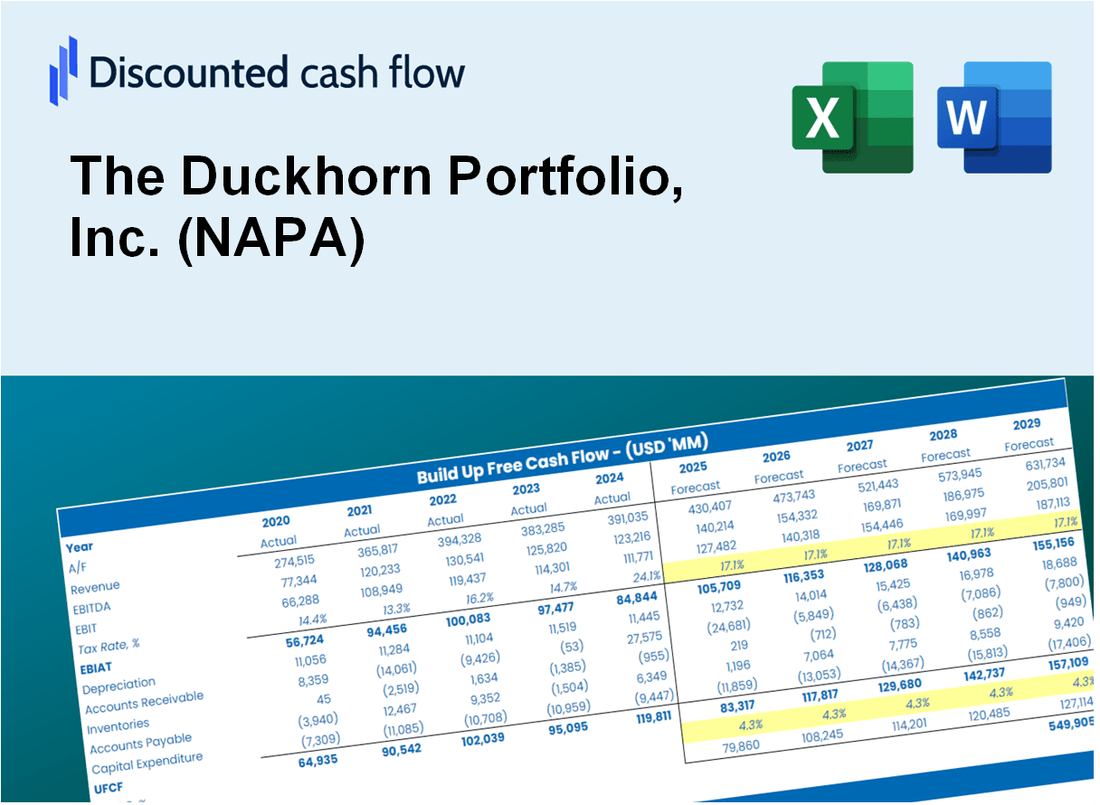
Descubra o verdadeiro valor do portfólio Duckhorn, Inc. (Napa) com nossa calculadora DCF avançada! Ajuste as principais suposições, explore vários cenários e avalie como diferentes mudanças afetam a avaliação do portfólio Duckhorn, Inc. (NAPA)-tudo dentro de um modelo de excelente fácil de usar.
What You Will Get
- Comprehensive NAPA Financials: Access to both historical and projected data for precise valuation.
- Customizable Inputs: Adjust WACC, tax rates, revenue growth, and capital expenditures to fit your analysis.
- Real-Time Calculations: Dynamic calculations for intrinsic value and NPV.
- Scenario Testing: Evaluate various scenarios to assess The Duckhorn Portfolio's future performance.
- User-Friendly Interface: Designed for industry experts while remaining accessible to newcomers.
Key Features
- Real-Life NAPA Data: Pre-filled with Duckhorn Portfolio’s historical financials and future projections.
- Fully Customizable Inputs: Adjust revenue growth, profit margins, WACC, tax rates, and capital expenditures.
- Dynamic Valuation Model: Automatic updates to Net Present Value (NPV) and intrinsic value based on your inputs.
- Scenario Testing: Create multiple forecasting scenarios to analyze various valuation outcomes.
- User-Friendly Design: Simple, structured, and tailored for both professionals and beginners.
How It Works
- Download the Template: Gain immediate access to the Excel-based Duckhorn Portfolio DCF Calculator.
- Input Your Assumptions: Modify the yellow-highlighted cells for growth rates, WACC, margins, and other variables.
- Instant Calculations: The model automatically refreshes the intrinsic value of Duckhorn Portfolio, Inc. (NAPA).
- Test Scenarios: Experiment with different assumptions to assess potential valuation shifts.
- Analyze and Decide: Utilize the findings to inform your investment or financial analysis.
Why Choose This Calculator for The Duckhorn Portfolio, Inc. (NAPA)?
- Accurate Data: Utilize real financials from The Duckhorn Portfolio, Inc. for trustworthy valuation outcomes.
- Customizable: Tailor key variables such as growth rates, WACC, and tax rates to align with your forecasts.
- Time-Saving: Ready-to-use calculations save you the hassle of starting from the ground up.
- Professional-Grade Tool: Crafted for investors, analysts, and consultants in the wine industry.
- User-Friendly: An intuitive design and clear instructions ensure accessibility for all users.
Who Should Use This Product?
- Wine Enthusiasts: Discover premium wine options and enhance your tasting experience with Duckhorn Portfolio's offerings.
- Sommelier Professionals: Utilize detailed product information to elevate wine pairing recommendations.
- Retailers: Access valuable insights to optimize inventory and sales strategies for high-quality wines.
- Investors: Gain a deeper understanding of the wine industry and evaluate investment opportunities within Duckhorn Portfolio, Inc. (NAPA).
- Students of Viticulture: Explore practical applications of wine production and marketing through real-world examples.
What the Template Contains
- Pre-Filled Data: Includes The Duckhorn Portfolio, Inc.'s historical financials and forecasts.
- Discounted Cash Flow Model: Editable DCF valuation model with automatic calculations.
- Weighted Average Cost of Capital (WACC): A dedicated sheet for calculating WACC based on custom inputs.
- Key Financial Ratios: Analyze The Duckhorn Portfolio, Inc.'s profitability, efficiency, and leverage.
- Customizable Inputs: Edit revenue growth, margins, and tax rates with ease.
- Clear Dashboard: Charts and tables summarizing key valuation results.
Disclaimer
All information, articles, and product details provided on this website are for general informational and educational purposes only. We do not claim any ownership over, nor do we intend to infringe upon, any trademarks, copyrights, logos, brand names, or other intellectual property mentioned or depicted on this site. Such intellectual property remains the property of its respective owners, and any references here are made solely for identification or informational purposes, without implying any affiliation, endorsement, or partnership.
We make no representations or warranties, express or implied, regarding the accuracy, completeness, or suitability of any content or products presented. Nothing on this website should be construed as legal, tax, investment, financial, medical, or other professional advice. In addition, no part of this site—including articles or product references—constitutes a solicitation, recommendation, endorsement, advertisement, or offer to buy or sell any securities, franchises, or other financial instruments, particularly in jurisdictions where such activity would be unlawful.
All content is of a general nature and may not address the specific circumstances of any individual or entity. It is not a substitute for professional advice or services. Any actions you take based on the information provided here are strictly at your own risk. You accept full responsibility for any decisions or outcomes arising from your use of this website and agree to release us from any liability in connection with your use of, or reliance upon, the content or products found herein.