
|
A Avaliação DCF da Corporação ODP (ODP) |
Totalmente Editável: Adapte-Se Às Suas Necessidades No Excel Ou Planilhas
Design Profissional: Modelos Confiáveis E Padrão Da Indústria
Pré-Construídos Para Uso Rápido E Eficiente
Compatível com MAC/PC, totalmente desbloqueado
Não É Necessária Experiência; Fácil De Seguir
The ODP Corporation (ODP) Bundle
Como investidor ou analista, esta calculadora DCF (ODP) serve como seu recurso essencial para uma avaliação precisa. Carregado com dados reais da ODP Corporation, você pode ajustar facilmente as previsões e observar os resultados em tempo real.
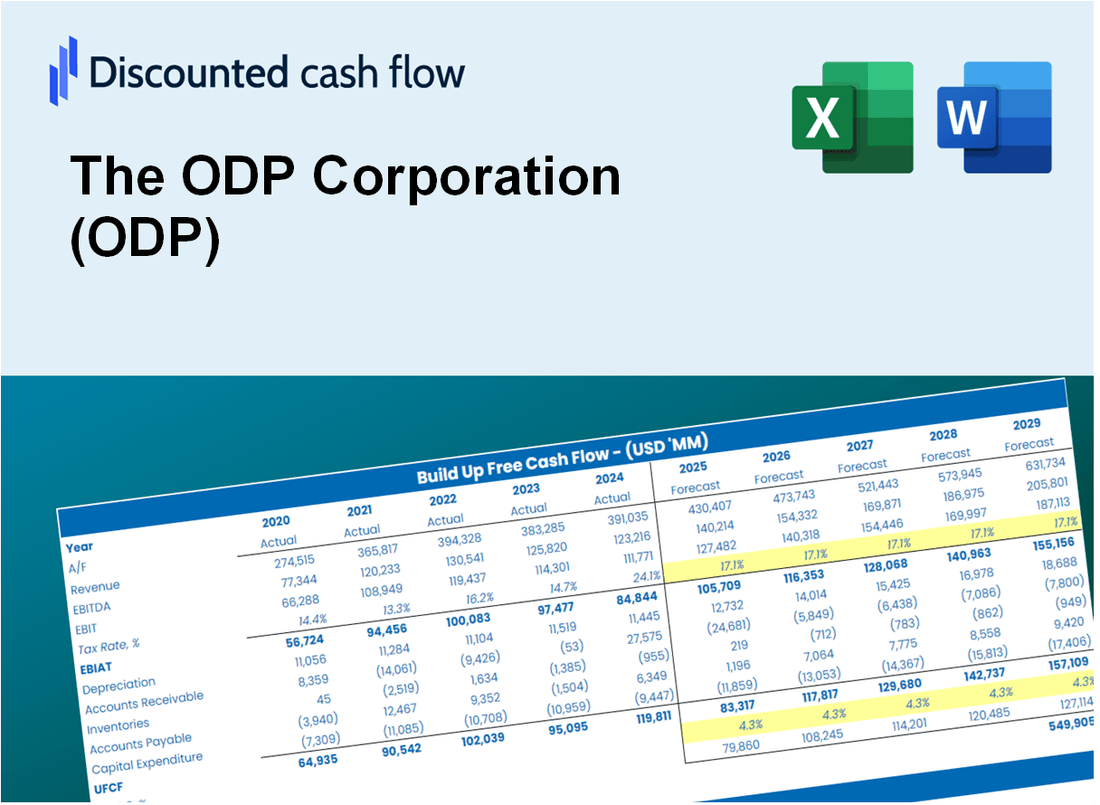
Discounted Cash Flow (DCF) - (USD MM)
| Year | AY1 2020 |
AY2 2021 |
AY3 2022 |
AY4 2023 |
AY5 2024 |
FY1 2025 |
FY2 2026 |
FY3 2027 |
FY4 2028 |
FY5 2029 |
|---|---|---|---|---|---|---|---|---|---|---|
| Revenue | 8,872.0 | 8,465.0 | 8,484.0 | 7,823.0 | 6,990.0 | 6,591.5 | 6,215.8 | 5,861.4 | 5,527.3 | 5,212.2 |
| Revenue Growth, % | 0 | -4.59 | 0.22445 | -7.79 | -10.65 | -5.7 | -5.7 | -5.7 | -5.7 | -5.7 |
| EBITDA | 161.0 | 405.0 | 439.0 | 448.0 | 266.0 | 280.9 | 264.9 | 249.8 | 235.5 | 222.1 |
| EBITDA, % | 1.81 | 4.78 | 5.17 | 5.73 | 3.81 | 4.26 | 4.26 | 4.26 | 4.26 | 4.26 |
| Depreciation | 157.0 | 146.0 | 118.0 | 99.0 | 97.0 | 99.4 | 93.7 | 88.4 | 83.3 | 78.6 |
| Depreciation, % | 1.77 | 1.72 | 1.39 | 1.27 | 1.39 | 1.51 | 1.51 | 1.51 | 1.51 | 1.51 |
| EBIT | 4.0 | 259.0 | 321.0 | 349.0 | 169.0 | 181.5 | 171.1 | 161.4 | 152.2 | 143.5 |
| EBIT, % | 0.04508566 | 3.06 | 3.78 | 4.46 | 2.42 | 2.75 | 2.75 | 2.75 | 2.75 | 2.75 |
| Total Cash | 729.0 | 514.0 | 403.0 | 392.0 | 166.0 | 348.4 | 328.5 | 309.8 | 292.1 | 275.5 |
| Total Cash, percent | .0 | .0 | .0 | .0 | .0 | .0 | .0 | .0 | .0 | .0 |
| Account Receivables | 442.0 | 495.0 | 536.0 | 491.0 | 466.0 | 396.7 | 374.1 | 352.7 | 332.6 | 313.7 |
| Account Receivables, % | 4.98 | 5.85 | 6.32 | 6.28 | 6.67 | 6.02 | 6.02 | 6.02 | 6.02 | 6.02 |
| Inventories | 930.0 | 859.0 | 828.0 | 765.0 | 770.0 | 674.8 | 636.3 | 600.0 | 565.8 | 533.6 |
| Inventories, % | 10.48 | 10.15 | 9.76 | 9.78 | 11.02 | 10.24 | 10.24 | 10.24 | 10.24 | 10.24 |
| Accounts Payable | 857.0 | 950.0 | 821.0 | 755.0 | 697.0 | 661.5 | 623.8 | 588.3 | 554.7 | 523.1 |
| Accounts Payable, % | 9.66 | 11.22 | 9.68 | 9.65 | 9.97 | 10.04 | 10.04 | 10.04 | 10.04 | 10.04 |
| Capital Expenditure | -68.0 | -73.0 | -99.0 | -105.0 | -98.0 | -73.0 | -68.9 | -64.9 | -61.2 | -57.8 |
| Capital Expenditure, % | -0.76646 | -0.86237 | -1.17 | -1.34 | -1.4 | -1.11 | -1.11 | -1.11 | -1.11 | -1.11 |
| Tax Rate, % | 102.05 | 102.05 | 102.05 | 102.05 | 102.05 | 102.05 | 102.05 | 102.05 | 102.05 | 102.05 |
| EBITAT | 33.6 | -233.2 | 174.7 | 147.4 | -3.5 | 71.4 | 67.3 | 63.5 | 59.9 | 56.5 |
| Depreciation | ||||||||||
| Changes in Account Receivables | ||||||||||
| Changes in Inventories | ||||||||||
| Changes in Accounts Payable | ||||||||||
| Capital Expenditure | ||||||||||
| UFCF | -392.4 | -49.2 | 54.7 | 183.4 | -42.5 | 226.8 | 115.5 | 108.9 | 102.7 | 96.9 |
| WACC, % | 6.55 | 4.42 | 5.58 | 5.32 | 4.42 | 5.26 | 5.26 | 5.26 | 5.26 | 5.26 |
| PV UFCF | ||||||||||
| SUM PV UFCF | 571.9 | |||||||||
| Long Term Growth Rate, % | 3.00 | |||||||||
| Free cash flow (T + 1) | 100 | |||||||||
| Terminal Value | 4,420 | |||||||||
| Present Terminal Value | 3,421 | |||||||||
| Enterprise Value | 3,993 | |||||||||
| Net Debt | 1,156 | |||||||||
| Equity Value | 2,837 | |||||||||
| Diluted Shares Outstanding, MM | 35 | |||||||||
| Equity Value Per Share | 81.06 |
What You Will Get
- Real ODP Financial Data: Pre-filled with The ODP Corporation’s historical and projected data for precise analysis.
- Fully Editable Template: Modify key inputs like revenue growth, WACC, and EBITDA % with ease.
- Automatic Calculations: See The ODP Corporation’s intrinsic value update instantly based on your changes.
- Professional Valuation Tool: Designed for investors, analysts, and consultants seeking accurate DCF results.
- User-Friendly Design: Simple structure and clear instructions for all experience levels.
Key Features
- 🔍 Real-Life ODP Financials: Pre-filled historical and projected data for The ODP Corporation (ODP).
- ✏️ Fully Customizable Inputs: Adjust all critical parameters (yellow cells) such as WACC, growth %, and tax rates.
- 📊 Professional DCF Valuation: Built-in formulas calculate The ODP Corporation’s intrinsic value using the Discounted Cash Flow method.
- ⚡ Instant Results: Visualize The ODP Corporation’s valuation instantly after making changes.
- Scenario Analysis: Test and compare outcomes for various financial assumptions side-by-side.
How It Functions
- Download the Template: Gain immediate access to the Excel-based ODP DCF Calculator.
- Input Your Assumptions: Modify the yellow-highlighted cells for growth rates, WACC, margins, and additional parameters.
- Instant Calculations: The model automatically refreshes ODP’s intrinsic value.
- Test Scenarios: Experiment with various assumptions to assess potential changes in valuation.
- Analyze and Decide: Utilize the results to inform your investment or financial analysis.
Why Choose This Calculator for The ODP Corporation (ODP)?
- Accuracy: Utilizes verified ODP financials for precise data representation.
- Flexibility: Allows users to freely test and adjust inputs as needed.
- Time-Saving: Avoid the complexity of constructing a DCF model from the ground up.
- Professional-Grade: Crafted with the expertise and usability expected at the CFO level.
- User-Friendly: Intuitive design makes it accessible for users without extensive financial modeling skills.
Who Should Use This Product?
- Investors: Evaluate The ODP Corporation's (ODP) market position before making investment decisions.
- CFOs and Financial Analysts: Enhance valuation methodologies and assess financial forecasts for The ODP Corporation.
- Startup Founders: Understand the valuation strategies of established companies like The ODP Corporation.
- Consultants: Create comprehensive valuation reports tailored for clients interested in The ODP Corporation.
- Students and Educators: Utilize real-time data from The ODP Corporation to learn and teach valuation principles.
What the Template Contains
- Operating and Balance Sheet Data: Pre-filled ODP Corporation historical data and forecasts, including revenue, EBITDA, EBIT, and capital expenditures.
- WACC Calculation: A dedicated sheet for Weighted Average Cost of Capital (WACC), including parameters like Beta, risk-free rate, and share price.
- DCF Valuation (Unlevered and Levered): Editable Discounted Cash Flow models showing intrinsic value with detailed calculations.
- Financial Statements: Pre-loaded financial statements (annual and quarterly) to support analysis.
- Key Ratios: Includes profitability, leverage, and efficiency ratios for ODP Corporation (ODP).
- Dashboard and Charts: Visual summary of valuation outputs and assumptions to analyze results easily.
Disclaimer
All information, articles, and product details provided on this website are for general informational and educational purposes only. We do not claim any ownership over, nor do we intend to infringe upon, any trademarks, copyrights, logos, brand names, or other intellectual property mentioned or depicted on this site. Such intellectual property remains the property of its respective owners, and any references here are made solely for identification or informational purposes, without implying any affiliation, endorsement, or partnership.
We make no representations or warranties, express or implied, regarding the accuracy, completeness, or suitability of any content or products presented. Nothing on this website should be construed as legal, tax, investment, financial, medical, or other professional advice. In addition, no part of this site—including articles or product references—constitutes a solicitation, recommendation, endorsement, advertisement, or offer to buy or sell any securities, franchises, or other financial instruments, particularly in jurisdictions where such activity would be unlawful.
All content is of a general nature and may not address the specific circumstances of any individual or entity. It is not a substitute for professional advice or services. Any actions you take based on the information provided here are strictly at your own risk. You accept full responsibility for any decisions or outcomes arising from your use of this website and agree to release us from any liability in connection with your use of, or reliance upon, the content or products found herein.