
|
Povos Bancorp da Carolina do Norte, Inc. (PEBK) Avaliação DCF |
Totalmente Editável: Adapte-Se Às Suas Necessidades No Excel Ou Planilhas
Design Profissional: Modelos Confiáveis E Padrão Da Indústria
Pré-Construídos Para Uso Rápido E Eficiente
Compatível com MAC/PC, totalmente desbloqueado
Não É Necessária Experiência; Fácil De Seguir
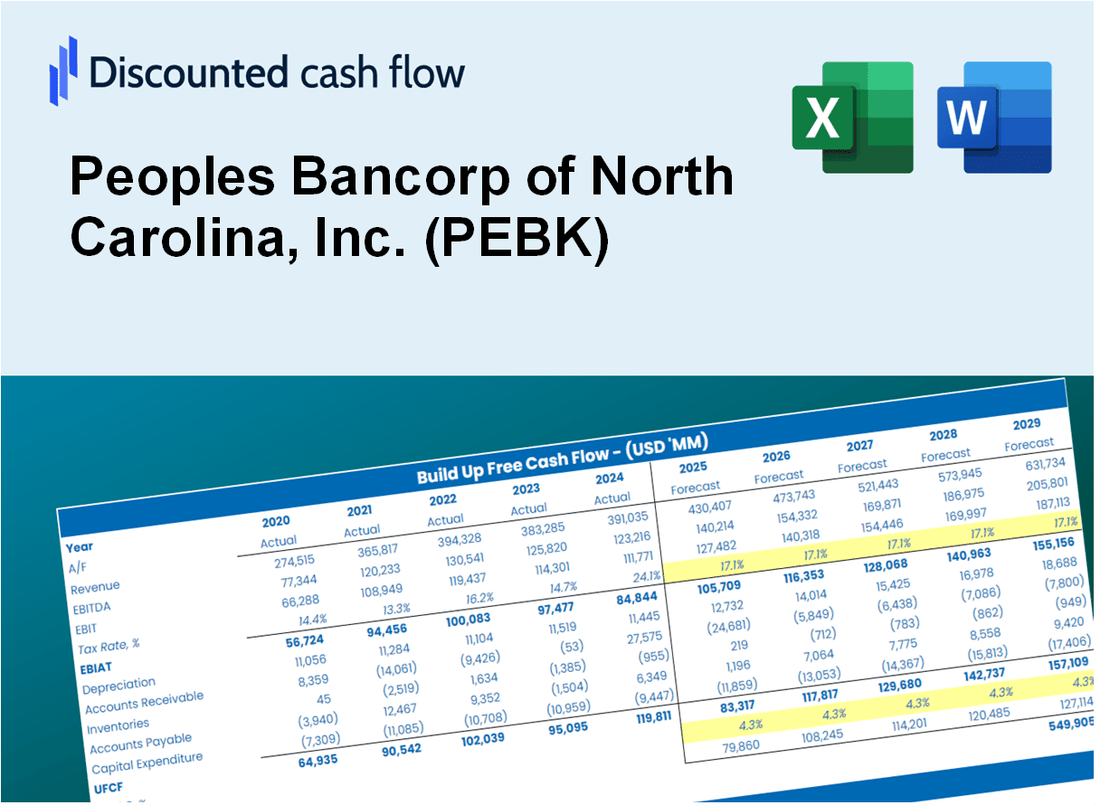
Peoples Bancorp of North Carolina, Inc. (PEBK) Bundle
Seja você um investidor ou analista, esta calculadora DCF (PEBK) é o seu recurso preferido para uma avaliação precisa. Pré -carregado com dados reais da Peoples Bancorp da North Carolina, Inc., você pode ajustar as previsões e observar instantaneamente os efeitos.
Discounted Cash Flow (DCF) - (USD MM)
| Year | AY1 2020 |
AY2 2021 |
AY3 2022 |
AY4 2023 |
AY5 2024 |
FY1 2025 |
FY2 2026 |
FY3 2027 |
FY4 2028 |
FY5 2029 |
|---|---|---|---|---|---|---|---|---|---|---|
| Revenue | 64.6 | 63.9 | 70.7 | 85.8 | 97.8 | 108.8 | 121.0 | 134.6 | 149.7 | 166.5 |
| Revenue Growth, % | 0 | -1.09 | 10.7 | 21.3 | 14.01 | 11.23 | 11.23 | 11.23 | 11.23 | 11.23 |
| EBITDA | 18.0 | 24.5 | 26.3 | 23.0 | 23.8 | 33.7 | 37.4 | 41.6 | 46.3 | 51.5 |
| EBITDA, % | 27.91 | 38.35 | 37.23 | 26.87 | 24.36 | 30.94 | 30.94 | 30.94 | 30.94 | 30.94 |
| Depreciation | 4.2 | 5.6 | 6.0 | 3.1 | 2.9 | 6.6 | 7.3 | 8.2 | 9.1 | 10.1 |
| Depreciation, % | 6.48 | 8.72 | 8.53 | 3.64 | 2.96 | 6.06 | 6.06 | 6.06 | 6.06 | 6.06 |
| EBIT | 13.8 | 18.9 | 20.3 | 19.9 | 20.9 | 27.1 | 30.1 | 33.5 | 37.2 | 41.4 |
| EBIT, % | 21.44 | 29.63 | 28.7 | 23.23 | 21.4 | 24.88 | 24.88 | 24.88 | 24.88 | 24.88 |
| Total Cash | 406.8 | 684.0 | 517.0 | 474.3 | 293.0 | 108.8 | 121.0 | 134.6 | 149.7 | 166.5 |
| Total Cash, percent | .0 | .0 | .0 | .0 | .0 | .0 | .0 | .0 | .0 | .0 |
| Account Receivables | 18.2 | 19.2 | 37.9 | .0 | .0 | 24.4 | 27.1 | 30.1 | 33.5 | 37.3 |
| Account Receivables, % | 28.18 | 30.13 | 53.64 | 0 | 0 | 22.39 | 22.39 | 22.39 | 22.39 | 22.39 |
| Inventories | .0 | .0 | .0 | .0 | .0 | .0 | .0 | .0 | .0 | .0 |
| Inventories, % | 0 | 0 | 0 | 0 | 0 | 0 | 0 | 0 | 0 | 0 |
| Accounts Payable | 10.1 | 11.8 | 12.2 | .0 | .0 | 11.2 | 12.4 | 13.8 | 15.4 | 17.1 |
| Accounts Payable, % | 15.57 | 18.54 | 17.22 | 0 | 0 | 10.27 | 10.27 | 10.27 | 10.27 | 10.27 |
| Capital Expenditure | -2.5 | -.5 | -4.6 | -1.9 | -.6 | -3.0 | -3.4 | -3.8 | -4.2 | -4.6 |
| Capital Expenditure, % | -3.86 | -0.75766 | -6.45 | -2.27 | -0.60024 | -2.79 | -2.79 | -2.79 | -2.79 | -2.79 |
| Tax Rate, % | 21.86 | 21.86 | 21.86 | 21.86 | 21.86 | 21.86 | 21.86 | 21.86 | 21.86 | 21.86 |
| EBITAT | 11.4 | 15.1 | 16.1 | 15.5 | 16.4 | 21.5 | 23.9 | 26.6 | 29.6 | 32.9 |
| Depreciation | ||||||||||
| Changes in Account Receivables | ||||||||||
| Changes in Inventories | ||||||||||
| Changes in Accounts Payable | ||||||||||
| Capital Expenditure | ||||||||||
| UFCF | 4.9 | 21.0 | -.8 | 42.5 | 18.7 | 11.9 | 26.4 | 29.4 | 32.7 | 36.4 |
| WACC, % | 18.35 | 18.03 | 17.95 | 17.74 | 17.76 | 17.97 | 17.97 | 17.97 | 17.97 | 17.97 |
| PV UFCF | ||||||||||
| SUM PV UFCF | 79.8 | |||||||||
| Long Term Growth Rate, % | 2.00 | |||||||||
| Free cash flow (T + 1) | 37 | |||||||||
| Terminal Value | 232 | |||||||||
| Present Terminal Value | 102 | |||||||||
| Enterprise Value | 181 | |||||||||
| Net Debt | -40 | |||||||||
| Equity Value | 221 | |||||||||
| Diluted Shares Outstanding, MM | 5 | |||||||||
| Equity Value Per Share | 40.29 |
What You Will Get
- Real PEBK Financial Data: Pre-filled with Peoples Bancorp of North Carolina's historical and projected data for precise analysis.
- Fully Editable Template: Modify key inputs like revenue growth, WACC, and EBITDA % with ease.
- Automatic Calculations: See Peoples Bancorp's intrinsic value update instantly based on your changes.
- Professional Valuation Tool: Designed for investors, analysts, and consultants seeking accurate DCF results.
- User-Friendly Design: Simple structure and clear instructions for all experience levels.
Key Features
- Comprehensive Financial Data: Peoples Bancorp of North Carolina, Inc.'s (PEBK) historical financial statements and detailed forecasts.
- Customizable Parameters: Adjust inputs for WACC, tax rates, revenue growth, and EBITDA margins as needed.
- Real-Time Valuation: Instantly view the intrinsic value of Peoples Bancorp of North Carolina, Inc. (PEBK) as it updates live.
- Intuitive Visualizations: Dashboard graphs present valuation outcomes and essential metrics clearly.
- Designed for Precision: A reliable tool tailored for analysts, investors, and finance professionals.
How It Works
- Step 1: Download the prebuilt Excel template featuring Peoples Bancorp of North Carolina, Inc. (PEBK) data.
- Step 2: Navigate through the pre-filled sheets to familiarize yourself with the essential metrics.
- Step 3: Adjust forecasts and assumptions in the editable yellow cells (WACC, growth, margins).
- Step 4: Instantly view updated results, including the intrinsic value of Peoples Bancorp of North Carolina, Inc. (PEBK).
- Step 5: Utilize the outputs to make informed investment decisions or create detailed reports.
Why Choose This Calculator for Peoples Bancorp of North Carolina, Inc. (PEBK)?
- Accurate Data: Utilize real financial figures from Peoples Bancorp for dependable valuation outcomes.
- Customizable: Tailor essential parameters such as growth rates, WACC, and tax rates to align with your forecasts.
- Time-Saving: Pre-configured calculations streamline the process, so you don’t have to start from scratch.
- Professional-Grade Tool: Crafted for investors, analysts, and consultants focusing on PEBK.
- User-Friendly: A clear layout and step-by-step guidance make it accessible for all users.
Who Should Use This Product?
- Finance Students: Explore banking fundamentals and apply them using real data from Peoples Bancorp of North Carolina, Inc. (PEBK).
- Academics: Integrate banking models into your curriculum or research projects.
- Investors: Evaluate your investment strategies and analyze the financial performance of Peoples Bancorp of North Carolina, Inc. (PEBK).
- Analysts: Enhance your analysis with a customizable financial model tailored for banking institutions.
- Small Business Owners: Understand how regional banks like Peoples Bancorp of North Carolina, Inc. (PEBK) assess business financing and growth opportunities.
What the Template Contains
- Pre-Filled DCF Model: Peoples Bancorp of North Carolina’s (PEBK) financial data preloaded for immediate use.
- WACC Calculator: Detailed calculations for Weighted Average Cost of Capital.
- Financial Ratios: Evaluate Peoples Bancorp’s (PEBK) profitability, leverage, and efficiency.
- Editable Inputs: Change assumptions such as growth, margins, and CAPEX to fit your scenarios.
- Financial Statements: Annual and quarterly reports to support detailed analysis.
- Interactive Dashboard: Easily visualize key valuation metrics and results.
Disclaimer
All information, articles, and product details provided on this website are for general informational and educational purposes only. We do not claim any ownership over, nor do we intend to infringe upon, any trademarks, copyrights, logos, brand names, or other intellectual property mentioned or depicted on this site. Such intellectual property remains the property of its respective owners, and any references here are made solely for identification or informational purposes, without implying any affiliation, endorsement, or partnership.
We make no representations or warranties, express or implied, regarding the accuracy, completeness, or suitability of any content or products presented. Nothing on this website should be construed as legal, tax, investment, financial, medical, or other professional advice. In addition, no part of this site—including articles or product references—constitutes a solicitation, recommendation, endorsement, advertisement, or offer to buy or sell any securities, franchises, or other financial instruments, particularly in jurisdictions where such activity would be unlawful.
All content is of a general nature and may not address the specific circumstances of any individual or entity. It is not a substitute for professional advice or services. Any actions you take based on the information provided here are strictly at your own risk. You accept full responsibility for any decisions or outcomes arising from your use of this website and agree to release us from any liability in connection with your use of, or reliance upon, the content or products found herein.