
|
Avaliação DCF da Provident Financial Services, Inc. (PFS) |
Totalmente Editável: Adapte-Se Às Suas Necessidades No Excel Ou Planilhas
Design Profissional: Modelos Confiáveis E Padrão Da Indústria
Pré-Construídos Para Uso Rápido E Eficiente
Compatível com MAC/PC, totalmente desbloqueado
Não É Necessária Experiência; Fácil De Seguir
Provident Financial Services, Inc. (PFS) Bundle
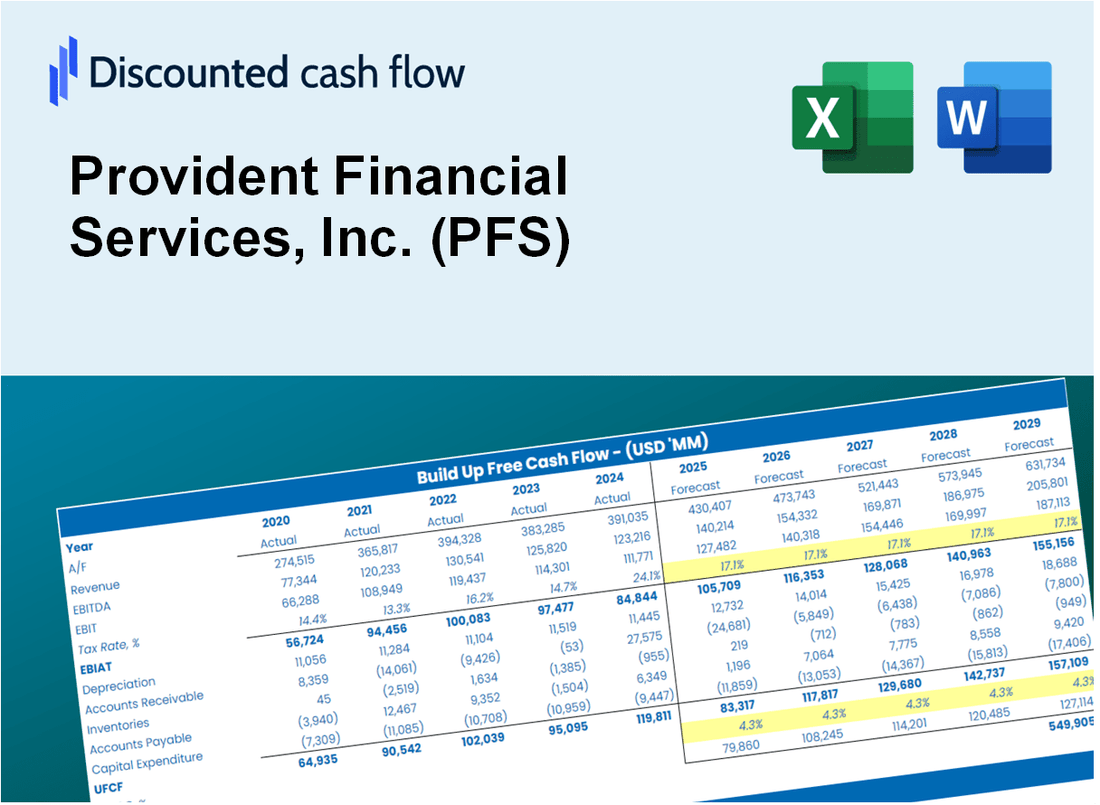
Obtenha informações sobre sua análise de avaliação da Provident Financial Services, Inc. (PFS) com nossa calculadora DCF de ponta! Pré -carregado com dados reais (PFS), este modelo do Excel permite ajustar as previsões e suposições, permitindo cálculos precisos dos serviços intrínsecos da Providence Financial Services, Inc..
Discounted Cash Flow (DCF) - (USD MM)
| Year | AY1 2020 |
AY2 2021 |
AY3 2022 |
AY4 2023 |
AY5 2024 |
FY1 2025 |
FY2 2026 |
FY3 2027 |
FY4 2028 |
FY5 2029 |
|---|---|---|---|---|---|---|---|---|---|---|
| Revenue | 435.7 | 489.1 | 554.0 | 695.6 | 1,140.3 | 1,468.1 | 1,890.1 | 2,433.5 | 3,133.1 | 4,033.8 |
| Revenue Growth, % | 0 | 12.26 | 13.25 | 25.58 | 63.91 | 28.75 | 28.75 | 28.75 | 28.75 | 28.75 |
| EBITDA | 147.6 | 249.8 | 263.8 | 198.0 | 204.2 | 525.4 | 676.4 | 870.9 | 1,121.3 | 1,443.6 |
| EBITDA, % | 33.87 | 51.08 | 47.62 | 28.46 | 17.91 | 35.79 | 35.79 | 35.79 | 35.79 | 35.79 |
| Depreciation | 20.0 | 22.7 | 23.7 | 22.2 | 54.6 | 63.1 | 81.3 | 104.7 | 134.7 | 173.5 |
| Depreciation, % | 4.6 | 4.65 | 4.28 | 3.19 | 4.79 | 4.3 | 4.3 | 4.3 | 4.3 | 4.3 |
| EBIT | 127.6 | 227.1 | 240.1 | 175.8 | 149.6 | 462.3 | 595.1 | 766.2 | 986.5 | 1,270.2 |
| EBIT, % | 29.27 | 46.43 | 43.34 | 25.27 | 13.12 | 31.49 | 31.49 | 31.49 | 31.49 | 31.49 |
| Total Cash | 1,637.8 | 2,770.3 | 1,990.1 | 1,870.4 | 2,974.9 | 1,468.1 | 1,890.1 | 2,433.5 | 3,133.1 | 4,033.8 |
| Total Cash, percent | .0 | .0 | .0 | .0 | .0 | .0 | .0 | .0 | .0 | .0 |
| Account Receivables | 46.5 | 42.0 | 51.9 | 59.0 | 91.2 | 132.4 | 170.4 | 219.4 | 282.5 | 363.7 |
| Account Receivables, % | 10.66 | 8.58 | 9.37 | 8.48 | 7.99 | 9.02 | 9.02 | 9.02 | 9.02 | 9.02 |
| Inventories | .0 | .0 | .0 | .0 | .0 | .0 | .0 | .0 | .0 | .0 |
| Inventories, % | 0 | 0 | 0 | 0 | 0 | 0 | 0 | 0 | 0 | 0 |
| Accounts Payable | .0 | .0 | .0 | .0 | .0 | .0 | .0 | .0 | .0 | .0 |
| Accounts Payable, % | 0 | 0 | 0 | 0 | 0 | 0 | 0 | 0 | 0 | 0 |
| Capital Expenditure | -12.8 | -13.8 | -9.4 | -7.5 | -1.3 | -25.4 | -32.7 | -42.1 | -54.2 | -69.8 |
| Capital Expenditure, % | -2.94 | -2.82 | -1.7 | -1.08 | -0.11462 | -1.73 | -1.73 | -1.73 | -1.73 | -1.73 |
| Tax Rate, % | 22.79 | 22.79 | 22.79 | 22.79 | 22.79 | 22.79 | 22.79 | 22.79 | 22.79 | 22.79 |
| EBITAT | 97.0 | 167.9 | 175.6 | 128.4 | 115.5 | 345.2 | 444.4 | 572.2 | 736.7 | 948.4 |
| Depreciation | ||||||||||
| Changes in Account Receivables | ||||||||||
| Changes in Inventories | ||||||||||
| Changes in Accounts Payable | ||||||||||
| Capital Expenditure | ||||||||||
| UFCF | 57.7 | 181.3 | 180.0 | 136.0 | 136.6 | 341.7 | 454.9 | 585.7 | 754.1 | 970.9 |
| WACC, % | 11.21 | 11 | 10.93 | 10.91 | 11.33 | 11.08 | 11.08 | 11.08 | 11.08 | 11.08 |
| PV UFCF | ||||||||||
| SUM PV UFCF | 2,173.2 | |||||||||
| Long Term Growth Rate, % | 2.00 | |||||||||
| Free cash flow (T + 1) | 990 | |||||||||
| Terminal Value | 10,909 | |||||||||
| Present Terminal Value | 6,452 | |||||||||
| Enterprise Value | 8,625 | |||||||||
| Net Debt | 2,216 | |||||||||
| Equity Value | 6,409 | |||||||||
| Diluted Shares Outstanding, MM | 110 | |||||||||
| Equity Value Per Share | 58.41 |
What You Will Get
- Editable Excel Template: A fully customizable Excel-based DCF Calculator featuring pre-filled real PFS financials.
- Real-World Data: Historical data and forward-looking estimates (highlighted in the yellow cells).
- Forecast Flexibility: Modify forecast assumptions such as revenue growth, EBITDA %, and WACC.
- Automatic Calculations: Instantly observe the impact of your inputs on Provident Financial Services’ valuation.
- Professional Tool: Designed for investors, CFOs, consultants, and financial analysts.
- User-Friendly Design: Organized for clarity and ease of use, complete with step-by-step instructions.
Key Features
- Comprehensive Financial Data: Access Provident Financial Services' historical financial statements and pre-filled forecasts.
- Customizable Parameters: Modify WACC, tax rates, revenue growth, and EBITDA margins to fit your analysis.
- Real-Time Valuation: Observe the intrinsic value of Provident Financial Services, Inc. (PFS) update instantly.
- Intuitive Visualizations: Interactive dashboard charts showcase valuation outcomes and essential metrics.
- Designed for Precision: A robust tool tailored for analysts, investors, and finance professionals.
How It Works
- Step 1: Download the prebuilt Excel template with Provident Financial Services, Inc.'s (PFS) data included.
- Step 2: Explore the pre-filled sheets and understand the key metrics.
- Step 3: Update forecasts and assumptions in the editable yellow cells (WACC, growth, margins).
- Step 4: Instantly view recalculated results, including Provident Financial Services, Inc.'s (PFS) intrinsic value.
- Step 5: Make informed investment decisions or generate reports using the outputs.
Why Choose This Calculator for Provident Financial Services, Inc. (PFS)?
- Accuracy: Utilizes real PFS financial data to ensure precise calculations.
- Flexibility: Built for users to easily adjust and test various input parameters.
- Time-Saving: Avoid the complexities of creating a DCF model from the ground up.
- Professional-Grade: Crafted with the expertise and standards expected by CFOs.
- User-Friendly: Intuitive design makes it accessible for all users, regardless of financial modeling skills.
Who Should Use This Product?
- Professional Investors: Create comprehensive and trustworthy valuation models for analyzing PFS portfolios.
- Corporate Finance Teams: Evaluate valuation scenarios to inform strategic decisions within the organization.
- Consultants and Advisors: Offer clients precise valuation insights for Provident Financial Services, Inc. (PFS).
- Students and Educators: Utilize real-world data to practice and instruct on financial modeling techniques.
- Banking and Finance Enthusiasts: Gain insights into how financial institutions like Provident Financial Services, Inc. (PFS) are valued in the market.
What the Template Contains
- Operating and Balance Sheet Data: Pre-filled Provident Financial Services historical data and forecasts, including revenue, EBITDA, EBIT, and capital expenditures.
- WACC Calculation: A dedicated sheet for Weighted Average Cost of Capital (WACC), featuring parameters such as Beta, risk-free rate, and share price.
- DCF Valuation (Unlevered and Levered): Editable Discounted Cash Flow models that showcase intrinsic value with detailed calculations.
- Financial Statements: Pre-loaded financial statements (annual and quarterly) to support comprehensive analysis.
- Key Ratios: Includes profitability, leverage, and efficiency ratios for Provident Financial Services, Inc. (PFS).
- Dashboard and Charts: Visual summary of valuation outputs and assumptions to facilitate easy analysis of results.
Disclaimer
All information, articles, and product details provided on this website are for general informational and educational purposes only. We do not claim any ownership over, nor do we intend to infringe upon, any trademarks, copyrights, logos, brand names, or other intellectual property mentioned or depicted on this site. Such intellectual property remains the property of its respective owners, and any references here are made solely for identification or informational purposes, without implying any affiliation, endorsement, or partnership.
We make no representations or warranties, express or implied, regarding the accuracy, completeness, or suitability of any content or products presented. Nothing on this website should be construed as legal, tax, investment, financial, medical, or other professional advice. In addition, no part of this site—including articles or product references—constitutes a solicitation, recommendation, endorsement, advertisement, or offer to buy or sell any securities, franchises, or other financial instruments, particularly in jurisdictions where such activity would be unlawful.
All content is of a general nature and may not address the specific circumstances of any individual or entity. It is not a substitute for professional advice or services. Any actions you take based on the information provided here are strictly at your own risk. You accept full responsibility for any decisions or outcomes arising from your use of this website and agree to release us from any liability in connection with your use of, or reliance upon, the content or products found herein.