
|
Quilter plc (qlt.l) avaliação dcf |
Totalmente Editável: Adapte-Se Às Suas Necessidades No Excel Ou Planilhas
Design Profissional: Modelos Confiáveis E Padrão Da Indústria
Pré-Construídos Para Uso Rápido E Eficiente
Compatível com MAC/PC, totalmente desbloqueado
Não É Necessária Experiência; Fácil De Seguir
Quilter plc (QLT.L) Bundle
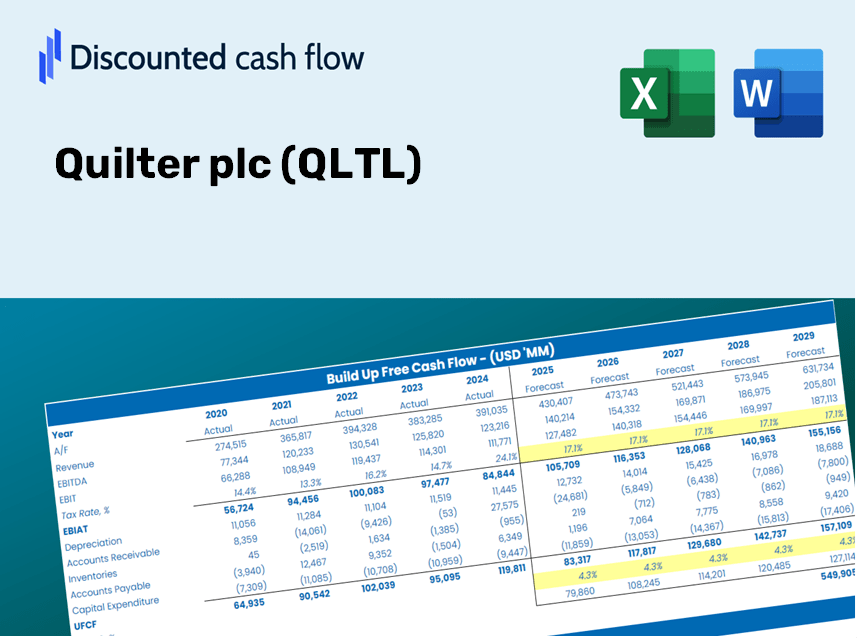
Aprimore suas estratégias de investimento com a calculadora DCF da Quilter PLC (QLTL)! Explore dados financeiros autênticos, ajuste as previsões e despesas do crescimento e observe instantaneamente como essas alterações afetam o valor intrínseco da Quilter PLC (QLTL).
Discounted Cash Flow (DCF) - (USD MM)
| Year | AY1 2020 |
AY2 2021 |
AY3 2022 |
AY4 2023 |
AY5 2024 |
FY1 2025 |
FY2 2026 |
FY3 2027 |
FY4 2028 |
FY5 2029 |
|---|---|---|---|---|---|---|---|---|---|---|
| Revenue | 3,461.0 | 4,686.0 | -4,040.0 | 4,626.0 | 5,420.0 | 3,422.2 | 2,160.7 | 1,364.3 | 861.4 | 543.9 |
| Revenue Growth, % | 0 | 35.39 | -186.21 | -214.5 | 17.16 | -36.86 | -36.86 | -36.86 | -36.86 | -36.86 |
| EBITDA | 162.0 | 160.0 | 144.0 | 163.0 | 108.0 | 68.8 | 43.4 | 27.4 | 17.3 | 10.9 |
| EBITDA, % | 4.68 | 3.41 | -3.56 | 3.52 | 1.99 | 2.01 | 2.01 | 2.01 | 2.01 | 2.01 |
| Depreciation | 63.0 | 63.0 | 59.0 | 52.0 | 52.0 | 25.9 | 16.4 | 10.3 | 6.5 | 4.1 |
| Depreciation, % | 1.82 | 1.34 | -1.46 | 1.12 | 0.95941 | 0.75756 | 0.75756 | 0.75756 | 0.75756 | 0.75756 |
| EBIT | 99.0 | 97.0 | 85.0 | 111.0 | 56.0 | 42.8 | 27.0 | 17.1 | 10.8 | 6.8 |
| EBIT, % | 2.86 | 2.07 | -2.1 | 2.4 | 1.03 | 1.25 | 1.25 | 1.25 | 1.25 | 1.25 |
| Total Cash | 1,614.0 | 49,340.0 | 45,135.0 | 51,864.0 | 60,944.0 | 1,688.0 | 1,065.8 | 673.0 | 424.9 | 268.3 |
| Total Cash, percent | .0 | .0 | .0 | .0 | .0 | .0 | .0 | .0 | .0 | .0 |
| Account Receivables | 617.0 | 388.0 | 313.0 | 479.0 | 420.0 | 249.6 | 157.6 | 99.5 | 62.8 | 39.7 |
| Account Receivables, % | 17.83 | 8.28 | -7.75 | 10.35 | 7.75 | 7.29 | 7.29 | 7.29 | 7.29 | 7.29 |
| Inventories | .0 | .0 | .0 | .0 | .0 | .0 | .0 | .0 | .0 | .0 |
| Inventories, % | 0 | 0 | 0 | 0 | 0 | 0 | 0 | 0 | 0 | 0 |
| Accounts Payable | 40.0 | 33.0 | 32.0 | 46.0 | 505.0 | 77.9 | 49.2 | 31.0 | 19.6 | 12.4 |
| Accounts Payable, % | 1.16 | 0.70423 | -0.79208 | 0.99438 | 9.32 | 2.28 | 2.28 | 2.28 | 2.28 | 2.28 |
| Capital Expenditure | -32.0 | -13.0 | -3.0 | -1.0 | -8.0 | -9.4 | -5.9 | -3.7 | -2.4 | -1.5 |
| Capital Expenditure, % | -0.92459 | -0.27742 | 0.07425743 | -0.02161695 | -0.1476 | -0.27425 | -0.27425 | -0.27425 | -0.27425 | -0.27425 |
| Tax Rate, % | 197.14 | 197.14 | 197.14 | 197.14 | 197.14 | 197.14 | 197.14 | 197.14 | 197.14 | 197.14 |
| EBITAT | 968.0 | 175.7 | 228.8 | 53.0 | -54.4 | 29.8 | 18.8 | 11.9 | 7.5 | 4.7 |
| Depreciation | ||||||||||
| Changes in Account Receivables | ||||||||||
| Changes in Inventories | ||||||||||
| Changes in Accounts Payable | ||||||||||
| Capital Expenditure | ||||||||||
| UFCF | 422.0 | 447.7 | 358.8 | -48.0 | 507.6 | -210.3 | 92.5 | 58.4 | 36.9 | 23.3 |
| WACC, % | 7.58 | 7.58 | 7.58 | 7.18 | 6.82 | 7.35 | 7.35 | 7.35 | 7.35 | 7.35 |
| PV UFCF | ||||||||||
| SUM PV UFCF | -24.3 | |||||||||
| Long Term Growth Rate, % | 2.00 | |||||||||
| Free cash flow (T + 1) | 24 | |||||||||
| Terminal Value | 444 | |||||||||
| Present Terminal Value | 312 | |||||||||
| Enterprise Value | 287 | |||||||||
| Net Debt | -1,309 | |||||||||
| Equity Value | 1,596 | |||||||||
| Diluted Shares Outstanding, MM | 1,392 | |||||||||
| Equity Value Per Share | 114.69 |
Benefits You'll Receive
- Customizable Excel Template: A fully editable Excel-based DCF Calculator featuring pre-populated financial data for Quilter plc (QLTL).
- Authentic Data: Access to historical performance data and projections (highlighted in the yellow cells).
- Flexible Forecasting: Adjust key assumptions such as revenue growth, EBITDA margin, and WACC to fit your analysis.
- Instant Calculations: Quickly observe how changes in your inputs affect the valuation of Quilter plc (QLTL).
- Professional-Grade Tool: Designed for investors, CFOs, consultants, and financial analysts alike.
- User-Friendly Interface: Organized for ease of navigation, complete with detailed step-by-step guidance.
Key Features
- Real-Time QLTL Data: Pre-loaded with Quilter plc’s historical financial performance and future growth estimates.
- Fully Adjustable Inputs: Tailor revenue growth, profit margins, WACC, tax rates, and capital expenditures to your preference.
- Dynamic Valuation Framework: Automatically recalculates Net Present Value (NPV) and intrinsic value based on your specified parameters.
- Scenario Analysis: Develop various forecasting scenarios to evaluate different valuation possibilities.
- User-Centric Interface: Intuitive and organized, catering to both industry professionals and newcomers.
How It Functions
- Step 1: Download the Excel spreadsheet.
- Step 2: Examine the pre-filled Quilter plc (QLTL) data (historical and forecasted).
- Step 3: Modify key assumptions (highlighted in yellow) based on your insights.
- Step 4: Observe automatic updates for Quilter plc’s intrinsic value.
- Step 5: Utilize the results for your investment choices or reporting needs.
Why Opt for This Calculator?
- Reliable Data: Utilize real Quilter plc (QLTL) financials for trustworthy valuation outcomes.
- Tailorable: Modify essential factors such as growth rates, WACC, and tax rates to align with your forecasts.
- Efficiency Boost: Ready-made calculations save you the effort of building from the ground up.
- Expert-Level Tool: Crafted for investors, analysts, and financial consultants.
- Easy to Use: A straightforward design paired with step-by-step guidance makes it accessible for everyone.
Who Can Benefit from This Product?
- Professional Investors: Develop comprehensive and accurate valuation models for portfolio assessment of Quilter plc (QLTL).
- Corporate Finance Teams: Evaluate valuation scenarios to inform internal strategies for Quilter plc (QLTL).
- Consultants and Advisors: Deliver precise valuation insights for clients interested in Quilter plc (QLTL).
- Students and Educators: Leverage real-time data to practice and teach financial modeling related to Quilter plc (QLTL).
- Finance Enthusiasts: Gain insights into how companies like Quilter plc (QLTL) are valued in the financial market.
Contents of the Template
- Pre-Filled DCF Model: Quilter plc’s (QLTL) financial data ready for immediate analysis.
- WACC Calculator: Comprehensive calculations for the Weighted Average Cost of Capital.
- Financial Ratios: Assess Quilter plc’s (QLTL) profitability, leverage, and operational efficiency.
- Editable Inputs: Customize assumptions such as growth rates, margins, and capital expenditures to suit your analysis.
- Financial Statements: Access annual and quarterly reports to facilitate in-depth evaluations.
- Interactive Dashboard: Effortlessly visualize essential valuation metrics and outcomes.
Disclaimer
All information, articles, and product details provided on this website are for general informational and educational purposes only. We do not claim any ownership over, nor do we intend to infringe upon, any trademarks, copyrights, logos, brand names, or other intellectual property mentioned or depicted on this site. Such intellectual property remains the property of its respective owners, and any references here are made solely for identification or informational purposes, without implying any affiliation, endorsement, or partnership.
We make no representations or warranties, express or implied, regarding the accuracy, completeness, or suitability of any content or products presented. Nothing on this website should be construed as legal, tax, investment, financial, medical, or other professional advice. In addition, no part of this site—including articles or product references—constitutes a solicitation, recommendation, endorsement, advertisement, or offer to buy or sell any securities, franchises, or other financial instruments, particularly in jurisdictions where such activity would be unlawful.
All content is of a general nature and may not address the specific circumstances of any individual or entity. It is not a substitute for professional advice or services. Any actions you take based on the information provided here are strictly at your own risk. You accept full responsibility for any decisions or outcomes arising from your use of this website and agree to release us from any liability in connection with your use of, or reliance upon, the content or products found herein.