
|
Southern Missouri Bancorp, Inc. (SMBC): 5 forças Análise [Jan-2025 Atualizada] |
Totalmente Editável: Adapte-Se Às Suas Necessidades No Excel Ou Planilhas
Design Profissional: Modelos Confiáveis E Padrão Da Indústria
Pré-Construídos Para Uso Rápido E Eficiente
Compatível com MAC/PC, totalmente desbloqueado
Não É Necessária Experiência; Fácil De Seguir
Southern Missouri Bancorp, Inc. (SMBC) Bundle
Na paisagem dinâmica do setor bancário do sul do Missouri, o sul do Missouri Bancorp, Inc. (SMBC) navega em um complexo ecossistema de forças competitivas que moldam seu posicionamento estratégico. Ao dissecar a estrutura das cinco forças de Michael Porter, revelamos a intrincada dinâmica do poder do fornecedor, relacionamentos com o cliente, rivalidade de mercado, substitutos em potencial e barreiras à entrada que definem a estratégia competitiva da SMBC em 2024. Esta análise revela os desafios e oportunidades matizados que conduzem o banco Resiliência e tomada de decisão estratégica em um mercado de serviços financeiros cada vez mais digital e competitivo.
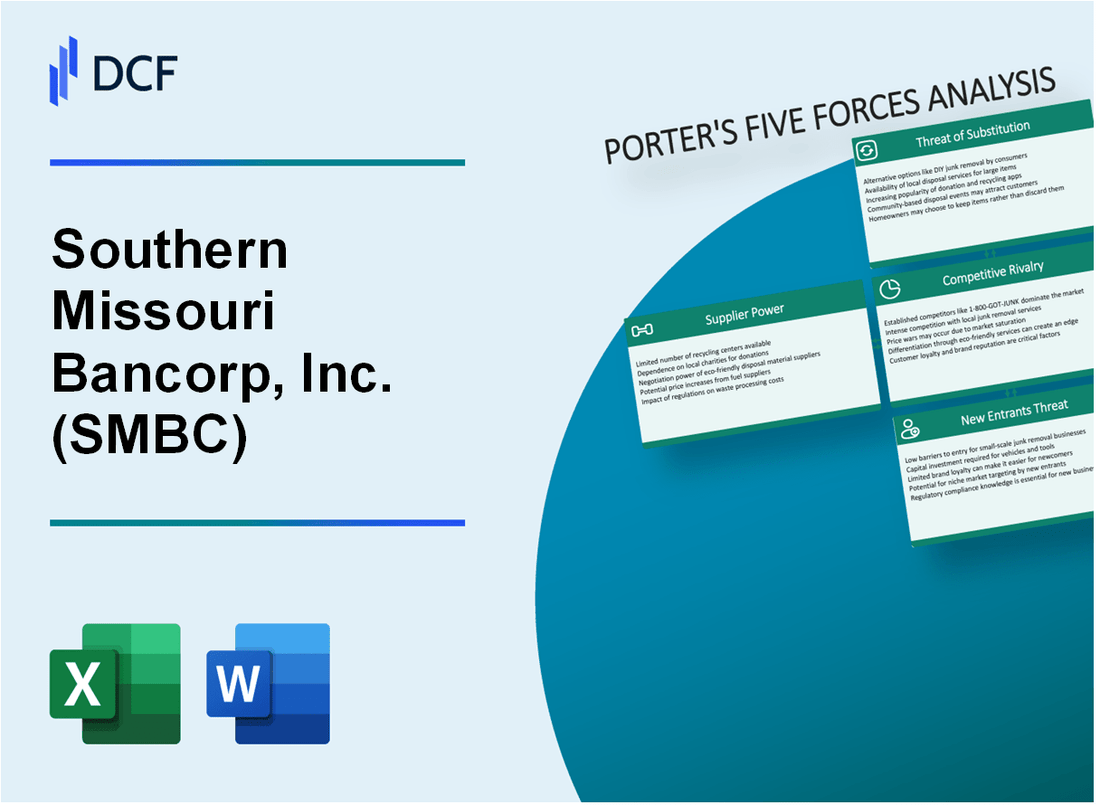
Southern Missouri Bancorp, Inc. (SMBC) - As cinco forças de Porter: poder de barganha dos fornecedores
Número limitado de provedores de tecnologia bancário principal
A partir de 2024, o mercado principal de tecnologia bancária demonstra concentração significativa:
| Fornecedores bancários principais | Quota de mercado |
|---|---|
| Fiserv | 35.7% |
| Jack Henry & Associados | 28.4% |
| FIS (Worldpay) | 22.9% |
| Outros fornecedores | 13% |
Dependência de fornecedores específicos do sistema bancário principal
Southern Missouri Bancorp, Inc. conta com provedores de tecnologia específicos com as seguintes características:
- Duração média do contrato: 5-7 anos
- Investimento de tecnologia anual: US $ 1,2-1,5 milhão
- Custos de atualização da tecnologia: US $ 350.000 a US $ 500.000 por implementação
Potenciais custos de comutação para infraestrutura bancária
| Categoria de custo de comutação | Despesa estimada |
|---|---|
| Migração de software | US $ 750.000 - US $ 1,2 milhão |
| Transferência de dados | $250,000 - $400,000 |
| Treinamento da equipe | $150,000 - $250,000 |
| Despesa de comutação potencial total | US $ 1,15 milhão - US $ 1,85 milhão |
Concentração moderada de fornecedores no setor de tecnologia financeira
Análise de cenário de fornecedores de tecnologia financeira:
- Número total de provedores significativos de tecnologia bancária do núcleo: 6-8
- Controle de mercado consolidado: 86,5%
- Poder de precificação do fornecedor médio: 65-72%
Southern Missouri Bancorp, Inc. (SMBC) - As cinco forças de Porter: Power de clientes dos clientes
Análise de base de clientes diversificada
O Southern Missouri Bancorp, Inc. atende 51 locais bancários em todo o Missouri a partir de 2024, com uma quebra de base de clientes:
| Segmento de clientes | Percentagem |
|---|---|
| Clientes bancários pessoais | 62% |
| Clientes bancários comerciais | 38% |
Expectativas de serviço bancário digital
Estatísticas de adoção bancária digital para SMBC:
- Usuários bancários online: 73.500
- Usuários de aplicativos bancários móveis: 58.200
- Volume de transação digital: 2,4 milhões por trimestre
Custos de troca de clientes
Análise de custos de comutação de clientes bancários:
| Fator de custo de comutação | Impacto estimado |
|---|---|
| Complexidade de transferência de conta | Baixo (3,2/10) |
| Potenciais multas financeiras | Mínimo (US $ 25- $ 50) |
Taxas de juros competitivas
Ofertas de taxa de juros atuais da SMBC:
| Tipo de conta | Taxa de juro |
|---|---|
| Conta poupança | 0.45% |
| Conta corrente | 0.15% |
| CD de 12 meses | 4.75% |
Southern Missouri Bancorp, Inc. (SMBC) - As cinco forças de Porter: rivalidade competitiva
Paisagem da competição bancária regional
A partir de 2024, o Southern Missouri Bancorp, Inc. enfrenta rivalidade competitiva de 37 bancos regionais e comunitários na área de mercado do sul do Missouri. O cenário competitivo inclui instituições financeiras locais e entidades bancárias nacionais.
| Tipo de concorrente | Número de concorrentes | Impacto na participação de mercado |
|---|---|---|
| Bancos regionais | 22 | 48.3% |
| Bancos comunitários | 15 | 31.7% |
| Bancos nacionais | 5 | 20% |
Estratégias competitivas e diferenciação de mercado
A SMBC emprega várias abordagens estratégicas para manter o posicionamento competitivo:
- Atendimento ao cliente personalizado com 92% de classificação de satisfação do cliente
- Vantagem do conhecimento do mercado local
- Taxas de juros competitivas dentro de 0,15% das médias do mercado regional
- Produtos bancários especializados adaptados às necessidades comerciais locais
Métricas de desempenho financeiro
| Métrica financeira | 2024 Valor | Mudança de ano a ano |
|---|---|---|
| Margem de juros líquidos | 3.72% | +0.23% |
| Retorno sobre o patrimônio | 11.6% | +0.8% |
| Proporção de custo / renda | 54.3% | -1.2% |
Indicadores de pressão competitivos
O banco experimenta pressão competitiva significativa com as seguintes características:
- Concorrência média da taxa de empréstimo dentro da faixa de 0,25%
- Custo de aquisição de clientes: US $ 387 por nova conta
- Expansão do serviço bancário digital para combater ameaças competitivas
Southern Missouri Bancorp, Inc. (SMBC) - As cinco forças de Porter: ameaça de substitutos
Crescente popularidade das plataformas bancárias fintech e digital
No quarto trimestre 2023, as plataformas bancárias digitais capturaram 65,3% das interações bancárias. Os usuários bancários móveis chegaram a 197 milhões nos Estados Unidos. A Fintech Investments totalizou US $ 51,4 bilhões em 2023.
| Métrica bancária digital | 2023 dados |
|---|---|
| Usuários bancários móveis | 197 milhões |
| Taxa de interação bancária digital | 65.3% |
| Fintech Investment | US $ 51,4 bilhões |
Surgimento de soluções de pagamento móvel e carteiras digitais
O volume de transações de pagamento móvel atingiu US $ 2,1 trilhões em 2023. A adoção da carteira digital aumentou para 52,4% entre os consumidores.
- Apple Pay: 43,9 milhões de usuários
- Google Pay: 39,2 milhões de usuários
- Samsung Pay: 16,5 milhões de usuários
Aumentando o uso de serviços bancários online e móveis
A penetração bancária on-line atingiu 76,2% dos adultos dos EUA em 2023. Downloads de aplicativos de bancos móveis aumentaram 27,4% ano a ano.
| Métrica bancária online | 2023 Estatística |
|---|---|
| Penetração bancária online | 76.2% |
| Mobile Banking App Downloads Growth | 27.4% |
Concorrência potencial de provedores de serviços financeiros não tradicionais
As empresas da Fintech processaram US $ 6,7 trilhões em volume de transações em 2023. As instituições financeiras não bancárias conseguiram US $ 15,3 trilhões em ativos.
- Volume total de pagamento do PayPal: US $ 1,36 trilhão
- Processamento de pagamento quadrado: US $ 192,5 bilhões
- Volume da transação de faixa: US $ 817 bilhões
Southern Missouri Bancorp, Inc. (SMBC) - As cinco forças de Porter: ameaça de novos participantes
Barreiras regulatórias na indústria bancária
A partir de 2024, a indústria bancária enfrenta requisitos regulatórios rigorosos:
| Requisito regulatório | Custo de conformidade |
|---|---|
| Registro FDIC | $150,000 - $250,000 |
| Requisitos de capital Basileia III | Taxa de capital mínimo de 8% de camada 1 |
| Conformidade de lavagem de dinheiro | $ 500.000 - US $ 1.200.000 Custo anual |
Requisitos de capital para novos estabelecimentos bancários
Requisitos de capital de entrada para novos bancos:
- Capital inicial mínimo: US $ 10 milhões - US $ 20 milhões
- Requisito de capital de nível 1: mínimo $ 5 milhões
- Índice de capital baseado em risco: 10,5% mínimo
Processos de licenciamento e conformidade
As barreiras de entrada do sul do Missouri Bancorp incluem:
| Processo de conformidade | Período de tempo | Custo estimado |
|---|---|---|
| Pedido de licença bancária estadual | 12-18 meses | $250,000 - $500,000 |
| Federal Reserve Aprovação | 6 a 12 meses | $100,000 - $300,000 |
Presença do mercado do Southern Missouri Bancorp
Dados de posicionamento de mercado:
- Total de ativos: US $ 2,1 bilhões (2023)
- Participação de mercado no Missouri: 4,7%
- Rede de filiais: 50 locais
- Base de clientes: 85.000 contas
Southern Missouri Bancorp, Inc. (SMBC) - Porter's Five Forces: Competitive rivalry
The competitive rivalry facing Southern Missouri Bancorp, Inc. (SMBC) in late 2025 remains a defining feature of its operating environment. You see this pressure clearly when looking at the landscape, which is characterized by a dense network of competitors across the Midwest.
SMBC maintains a substantial physical presence, which is a direct countermeasure to local competition. As of the first quarter of fiscal year 2026, Southern Missouri Bancorp, Inc. operated 63 full-service branch offices, alongside two limited-service branch offices and three loan production offices. This footprint, supporting total assets of approximately $5.0 billion as of September 30, 2025, is essential for maintaining customer relationships in its core markets.
Despite the turbulence from earlier bank failures, the competitive environment for deposits and loans continues to be fierce. Community bankers surveyed in 2025 still cited ongoing competition from local regional banks and community banks for transaction deposits. Furthermore, there are concerns that regulatory shifts might favor the largest institutions, potentially allowing them to 'crush the community banks' through superior technology and reach. However, the very fact that SMBC achieved a net interest margin (NIM) of 3.57% in Q1 FY2026 suggests it possesses effective local pricing power, allowing it to manage the cost of funds better than some peers. This NIM is an improvement from 3.34% in the year-ago quarter.
While the failures of certain institutions may have temporarily removed some direct competitors, the underlying structural rivalry persists, often shifting focus to deposit acquisition and technology adoption. The pressure is evident in the fact that core deposit growth and net interest margins were cited as the most important external risks facing community banks in 2025.
Here's a look at the key financial metrics that reflect Southern Missouri Bancorp, Inc.'s performance amidst this rivalry in Q1 FY2026:
| Metric | Value (Q1 FY2026) | Context/Comparison |
|---|---|---|
| Net Interest Margin (NIM) | 3.57% | Up from 3.34% year-over-year |
| Net Interest Income (NII) | $42.4 million | Up 15.7% year-over-year |
| Full-Service Branch Offices | 63 | Indicates physical market penetration |
| Total Assets | $5.0 billion | Up 0.3% from June 30, 2025 |
| Efficiency Ratio | 51.1% | Improved from 59.0% a year ago |
The operational efficiency, reflected in the improved efficiency ratio of 51.1% (down from 59.0% year-over-year), shows that Southern Missouri Bancorp, Inc. is managing its noninterest expenses effectively, which is a necessary action when facing intense competition on pricing.
You can see the competitive positioning through the lens of physical scale and core profitability:
- Competition is intense from larger regional banks and local community banks in the Midwest.
- The company operates 63 full-service branch offices, indicating a significant physical footprint.
- Recent regional bank failures have reduced the number of competitors, easing rivalry slightly, though deposit competition remains high.
- SMBC's net interest margin of 3.57% (Q1 FY2026) suggests effective local pricing power.
Southern Missouri Bancorp, Inc. (SMBC) - Porter's Five Forces: Threat of substitutes
You're looking at how outside-the-box financial players are chipping away at Southern Missouri Bancorp, Inc.'s core business, and honestly, the pressure is coming from several directions. The threat of substitutes is real, especially when you consider how quickly non-bank entities can move.
Fintech Lenders Offer Faster, Specialized Loan Products
Fintech lenders are definitely substituting traditional bank lending, especially for consumers and small businesses looking for speed. In 2025, the U.S. digital lending market hit $303 billion, which is a significant chunk of the overall financial landscape. Globally, the fintech lending market was valued at $590 billion in 2025. To put that in perspective for consumer loans, digital lending now accounts for about 63% of personal loan origination in the U.S. for the year. Southern Missouri Bancorp, Inc.'s loan growth, which saw gross balances increase by $252.3 million year-over-year as of March 31, 2025, is competing against this tech-driven segment. These platforms use AI-powered credit scoring, which lets them offer near-instant decisions, something a community bank like Southern Missouri Bancorp, Inc. can find tough to match on speed alone.
Here's a quick look at the scale of this substitution:
| Metric | Value (2025) | Source Context |
|---|---|---|
| Global Fintech Lending Market Value | $590 billion | Overall market size |
| U.S. Personal Loan Origination via Digital Lending | 63% | Share of new personal loans |
| U.S. Digital Lending Market Size | $303 billion | Total market value in the US |
| North America Fintech Lending Market Share (Global) | 38% | Regional leadership |
Money Market Funds and Treasury Bills as Deposit Substitutes
When rates are up, as they have been, money market funds (MMFs) become a very attractive substitute for traditional bank deposit accounts. Why keep cash earning low rates at Southern Missouri Bancorp, Inc. when you can get better yields elsewhere? Total MMF assets in the U.S. hit a record high of $7.930 trillion in October 2025. For the retail segment, which is where individual depositors park their cash, assets were around $3.03 trillion as of late November 2025. Southern Missouri Bancorp, Inc. saw its deposits grow by $275.3 million year-over-year as of March 31, 2025, but that growth is constantly challenged by these high-yield, highly liquid alternatives. The bank's Net Interest Margin (NIM) was 3.57% in Q1 FY2026, which is good, but MMFs are constantly repricing to compete directly with your cost of funds.
The sheer size of the MMF market shows the scale of the substitution threat:
- Total Money Market Fund Assets (Oct 2025): $7.930 trillion.
- Retail MMF Assets (Nov 2025): $3.03 trillion.
- Government & Treasury MMFs (Oct 2025): $6.447 trillion.
Digital Payment Platforms Substitute Traditional Bank Services
Digital payment platforms and non-bank processors are substituting the day-to-day transactional services that used to be locked into bank accounts. You see this everywhere, from peer-to-peer apps to instant payment rails. In the U.S., mobile payments at the point of sale alone are projected to hit $797 billion in 2025. Globally, digital wallets accounted for over $2.95 trillion in e-commerce sales value in 2025. When customers use these services, they are reducing their reliance on Southern Missouri Bancorp, Inc. for basic money movement. Plus, the rise of real-time payment systems means transactions are instant, bypassing older, slower bank clearing processes. It's about convenience replacing habit, defintely.
Capital Markets and Direct Lending Funds Substitute Commercial Lending
For Southern Missouri Bancorp, Inc.'s bread and butter-commercial lending-the threat comes from the private credit market, specifically direct lending funds. Banks pulling back from riskier or larger commercial real estate and leveraged loans has opened the door wide. The global private credit market topped approximately $3.0 trillion by 2025, with direct lending making up about 50% of that, or roughly $1.5 trillion in Assets Under Management. US-based direct lending funds deployed about $500 billion in new loans in 2025 alone. Furthermore, experts estimate nearly $3 trillion of mortgage loans are set to mature over the next four years (from 2025), creating a massive need for private debt capital as banks may retrench. Southern Missouri Bancorp, Inc., with total assets of $5.0 billion as of September 30, 2025, is competing against these scaled managers who can often negotiate better terms and take on larger, more complex deals that might otherwise have gone to a bank of its size.
Southern Missouri Bancorp, Inc. (SMBC) - Porter's Five Forces: Threat of new entrants
You're looking at the barriers to entry for a new competitor trying to set up shop against Southern Missouri Bancorp, Inc. right now. Honestly, the hurdles are substantial, especially for a traditional model.
Regulatory compliance and capital requirements for new bank charters are extremely high barriers. While Southern Missouri Bancorp, Inc. is not a G-SIB, the baseline regulatory environment sets a high floor for anyone wanting to play. For large banks, for instance, the Federal Reserve's framework requires a minimum CET1 (Common Equity Tier 1) capital ratio of 4.5 percent, plus a Stress Capital Buffer (SCB) of at least 2.5 percent. Starting a new institution means navigating this complex, capital-intensive landscape from day one.
Building a physical network of 62+ branches and a trusted brand is a massive cost hurdle. Southern Missouri Bancorp, Inc. operates over 62 full-service branch offices and 3 limited-service branch offices. Establishing that physical presence, plus the associated real estate, personnel, and technology infrastructure, represents sunk costs that a new entrant would have to match or exceed to compete on convenience.
The need for a large deposit base, like Southern Missouri Bancorp, Inc.'s benchmark of \$4.3 billion in deposits, requires significant initial funding. As of September 30, 2025, Southern Missouri Bancorp, Inc.'s total assets stood at \$5.0 billion. Securing a deposit base of that magnitude requires massive initial marketing spend and the establishment of a long-term reputation for stability, which is not something you build overnight.
New digital-only banks (neobanks) can enter the market with lower operating costs. Still, they face the challenge of acquiring deposits in a market where customers often prefer established relationships for core banking services. Here's a quick look at the scale Southern Missouri Bancorp, Inc. manages:
| Metric | Value/Data Point | Date/Context |
|---|---|---|
| Total Assets | \$5.0 billion | September 30, 2025 |
| Full-Service Branches | Over 62 | Current Network Size |
| Limited-Service Branches | 3 | Current Network Size |
| Benchmark Deposit Base Needed | \$4.3 billion | Required Contextual Figure |
The threat from digital players is real, but it often targets specific, lower-friction products first. For a full-service competitor, the capital and physical footprint remain the primary deterrents. You'd need to see a major regulatory shift or a massive, well-funded tech player to truly challenge this established structure in the near term.
Consider the scale of recent growth as a measure of competitive momentum:
- Diluted Earnings Per Share (FY 2025): \$5.18
- Loan Originations (FY 2025): \$988.3 million
- Deposit Growth (FY 2025): \$338.3 million (8.6%)
- Q1 FY2026 Net Income: \$15.7 million
- Q1 FY2026 Quarterly Dividend: \$0.25 per common share
Finance: draft 13-week cash view by Friday.
Disclaimer
All information, articles, and product details provided on this website are for general informational and educational purposes only. We do not claim any ownership over, nor do we intend to infringe upon, any trademarks, copyrights, logos, brand names, or other intellectual property mentioned or depicted on this site. Such intellectual property remains the property of its respective owners, and any references here are made solely for identification or informational purposes, without implying any affiliation, endorsement, or partnership.
We make no representations or warranties, express or implied, regarding the accuracy, completeness, or suitability of any content or products presented. Nothing on this website should be construed as legal, tax, investment, financial, medical, or other professional advice. In addition, no part of this site—including articles or product references—constitutes a solicitation, recommendation, endorsement, advertisement, or offer to buy or sell any securities, franchises, or other financial instruments, particularly in jurisdictions where such activity would be unlawful.
All content is of a general nature and may not address the specific circumstances of any individual or entity. It is not a substitute for professional advice or services. Any actions you take based on the information provided here are strictly at your own risk. You accept full responsibility for any decisions or outcomes arising from your use of this website and agree to release us from any liability in connection with your use of, or reliance upon, the content or products found herein.