
|
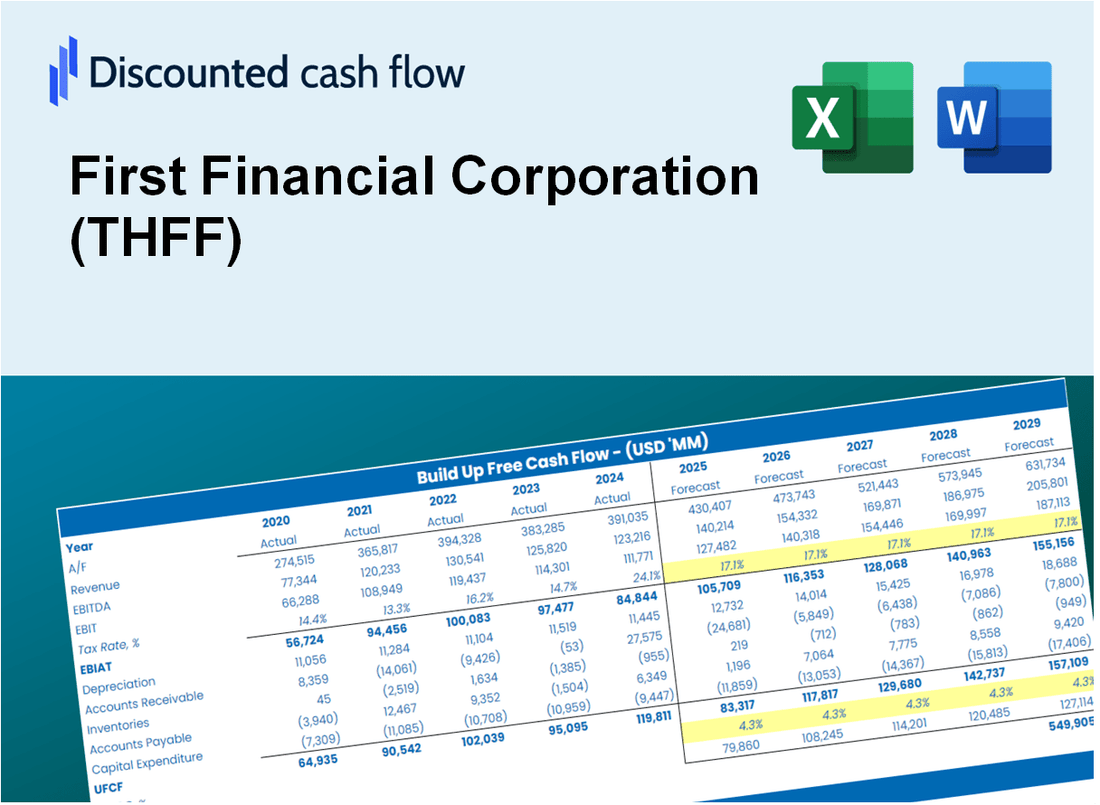
Avaliação DCF da Primeira Corporação Financeira (THFF) |
Totalmente Editável: Adapte-Se Às Suas Necessidades No Excel Ou Planilhas
Design Profissional: Modelos Confiáveis E Padrão Da Indústria
Pré-Construídos Para Uso Rápido E Eficiente
Compatível com MAC/PC, totalmente desbloqueado
Não É Necessária Experiência; Fácil De Seguir
First Financial Corporation (THFF) Bundle
Seja você um investidor ou analista, esta calculadora DCF (THFF) é o seu recurso preferido para uma avaliação precisa. Totalmente equipado com dados reais da First Financial Corporation, você pode ajustar facilmente as previsões e observar os efeitos em tempo real.
Discounted Cash Flow (DCF) - (USD MM)
| Year | AY1 2020 |
AY2 2021 |
AY3 2022 |
AY4 2023 |
AY5 2024 |
FY1 2025 |
FY2 2026 |
FY3 2027 |
FY4 2028 |
FY5 2029 |
|---|---|---|---|---|---|---|---|---|---|---|
| Revenue | 203.0 | 194.3 | 230.0 | 271.1 | 307.5 | 342.4 | 381.3 | 424.6 | 472.8 | 526.5 |
| Revenue Growth, % | 0 | -4.28 | 18.39 | 17.86 | 13.43 | 11.35 | 11.35 | 11.35 | 11.35 | 11.35 |
| EBITDA | 71.6 | 71.8 | 93.9 | 79.0 | 67.1 | 112.3 | 125.1 | 139.3 | 155.1 | 172.7 |
| EBITDA, % | 35.29 | 36.94 | 40.81 | 29.15 | 21.82 | 32.8 | 32.8 | 32.8 | 32.8 | 32.8 |
| Depreciation | 6.1 | 6.2 | 6.1 | 6.5 | 9.9 | 9.9 | 11.0 | 12.3 | 13.7 | 15.2 |
| Depreciation, % | 3 | 3.17 | 2.66 | 2.41 | 3.23 | 2.89 | 2.89 | 2.89 | 2.89 | 2.89 |
| EBIT | 65.5 | 65.6 | 87.8 | 72.5 | 57.2 | 102.4 | 114.0 | 127.0 | 141.4 | 157.5 |
| EBIT, % | 32.29 | 33.77 | 38.15 | 26.74 | 18.59 | 29.91 | 29.91 | 29.91 | 29.91 | 29.91 |
| Total Cash | 1,678.2 | 2,047.5 | 1,553.0 | 1,335.9 | 820.5 | 342.4 | 381.3 | 424.6 | 472.8 | 526.5 |
| Total Cash, percent | .0 | .0 | .0 | .0 | .0 | .0 | .0 | .0 | .0 | .0 |
| Account Receivables | 17.0 | 16.9 | 21.3 | 24.9 | 26.9 | 30.3 | 33.8 | 37.6 | 41.9 | 46.6 |
| Account Receivables, % | 8.35 | 8.72 | 9.25 | 9.18 | 8.76 | 8.85 | 8.85 | 8.85 | 8.85 | 8.85 |
| Inventories | .0 | .0 | .0 | .0 | .0 | .0 | .0 | .0 | .0 | .0 |
| Inventories, % | 0 | 0 | 0 | 0 | 0 | 0 | 0 | 0 | 0 | 0 |
| Accounts Payable | .0 | .0 | .0 | .0 | .0 | .0 | .0 | .0 | .0 | .0 |
| Accounts Payable, % | 0 | 0 | 0 | 0 | 0 | 0 | 0 | 0 | 0 | 0 |
| Capital Expenditure | -3.9 | -3.8 | -1.4 | -6.5 | -6.1 | -6.1 | -6.8 | -7.6 | -8.4 | -9.4 |
| Capital Expenditure, % | -1.93 | -1.97 | -0.61995 | -2.41 | -1.99 | -1.78 | -1.78 | -1.78 | -1.78 | -1.78 |
| Tax Rate, % | 17.28 | 17.28 | 17.28 | 17.28 | 17.28 | 17.28 | 17.28 | 17.28 | 17.28 | 17.28 |
| EBITAT | 53.8 | 53.0 | 71.1 | 60.7 | 47.3 | 84.1 | 93.6 | 104.2 | 116.0 | 129.2 |
| Depreciation | ||||||||||
| Changes in Account Receivables | ||||||||||
| Changes in Inventories | ||||||||||
| Changes in Accounts Payable | ||||||||||
| Capital Expenditure | ||||||||||
| UFCF | 39.1 | 55.3 | 71.5 | 57.1 | 49.1 | 84.5 | 94.4 | 105.1 | 117.0 | 130.3 |
| WACC, % | 12.72 | 12.58 | 12.6 | 12.87 | 12.78 | 12.71 | 12.71 | 12.71 | 12.71 | 12.71 |
| PV UFCF | ||||||||||
| SUM PV UFCF | 366.8 | |||||||||
| Long Term Growth Rate, % | 2.00 | |||||||||
| Free cash flow (T + 1) | 133 | |||||||||
| Terminal Value | 1,241 | |||||||||
| Present Terminal Value | 682 | |||||||||
| Enterprise Value | 1,049 | |||||||||
| Net Debt | 122 | |||||||||
| Equity Value | 927 | |||||||||
| Diluted Shares Outstanding, MM | 12 | |||||||||
| Equity Value Per Share | 78.52 |
What You Will Receive
- Comprehensive Financial Model: First Financial Corporation's (THFF) actual data facilitates accurate DCF valuation.
- Complete Forecast Control: Modify revenue growth, profit margins, WACC, and other crucial factors.
- Real-Time Calculations: Automatic updates provide immediate results as you adjust inputs.
- Professional-Grade Template: A polished Excel file crafted for high-quality valuation.
- Flexible and Reusable: Designed for adaptability, allowing for repeated use in detailed forecasting.
Key Features
- Pre-Loaded Data: First Financial Corporation’s historical financial statements and pre-filled forecasts.
- Fully Adjustable Inputs: Customize WACC, tax rates, revenue growth, and EBITDA margins.
- Instant Results: Observe First Financial Corporation’s intrinsic value recalculating in real time.
- Clear Visual Outputs: Dashboard charts illustrate valuation results and key metrics.
- Built for Accuracy: A professional tool designed for analysts, investors, and finance experts.
How It Works
- Download the Template: Gain immediate access to the Excel-based THFF DCF Calculator.
- Input Your Assumptions: Modify the yellow-highlighted cells for growth rates, WACC, margins, and other variables.
- Instant Calculations: The model automatically refreshes First Financial Corporation’s intrinsic value.
- Test Scenarios: Experiment with various assumptions to assess potential changes in valuation.
- Analyze and Decide: Utilize the results to inform your investment or financial decisions.
Why Choose This Calculator for First Financial Corporation (THFF)?
- User-Friendly Design: Suitable for both novices and seasoned professionals.
- Customizable Inputs: Modify variables effortlessly to suit your financial analysis.
- Real-Time Adjustments: Observe immediate updates to First Financial's valuation as you tweak inputs.
- Pre-Loaded Data: Comes equipped with First Financial's current financial metrics for swift evaluations.
- Relied Upon by Experts: Trusted by investors and analysts for making well-informed choices.
Who Should Use This Product?
- Investors: Accurately assess First Financial Corporation’s (THFF) fair value before making investment choices.
- CFOs: Utilize a professional-grade DCF model for financial reporting and analysis specific to (THFF).
- Consultants: Efficiently customize the template for valuation reports tailored to (THFF) clients.
- Entrepreneurs: Acquire knowledge on financial modeling practices employed by leading companies like (THFF).
- Educators: Implement it as a teaching resource to illustrate valuation methodologies related to (THFF).
What the Template Contains
- Pre-Filled Data: Includes First Financial Corporation’s (THFF) historical financials and forecasts.
- Discounted Cash Flow Model: Editable DCF valuation model with automatic calculations.
- Weighted Average Cost of Capital (WACC): A dedicated sheet for calculating WACC based on custom inputs.
- Key Financial Ratios: Analyze First Financial Corporation’s (THFF) profitability, efficiency, and leverage.
- Customizable Inputs: Edit revenue growth, margins, and tax rates with ease.
- Clear Dashboard: Charts and tables summarizing key valuation results.
Disclaimer
All information, articles, and product details provided on this website are for general informational and educational purposes only. We do not claim any ownership over, nor do we intend to infringe upon, any trademarks, copyrights, logos, brand names, or other intellectual property mentioned or depicted on this site. Such intellectual property remains the property of its respective owners, and any references here are made solely for identification or informational purposes, without implying any affiliation, endorsement, or partnership.
We make no representations or warranties, express or implied, regarding the accuracy, completeness, or suitability of any content or products presented. Nothing on this website should be construed as legal, tax, investment, financial, medical, or other professional advice. In addition, no part of this site—including articles or product references—constitutes a solicitation, recommendation, endorsement, advertisement, or offer to buy or sell any securities, franchises, or other financial instruments, particularly in jurisdictions where such activity would be unlawful.
All content is of a general nature and may not address the specific circumstances of any individual or entity. It is not a substitute for professional advice or services. Any actions you take based on the information provided here are strictly at your own risk. You accept full responsibility for any decisions or outcomes arising from your use of this website and agree to release us from any liability in connection with your use of, or reliance upon, the content or products found herein.