
|
UTZ Brands, Inc. (UTZ) Avaliação DCF |
Totalmente Editável: Adapte-Se Às Suas Necessidades No Excel Ou Planilhas
Design Profissional: Modelos Confiáveis E Padrão Da Indústria
Pré-Construídos Para Uso Rápido E Eficiente
Compatível com MAC/PC, totalmente desbloqueado
Não É Necessária Experiência; Fácil De Seguir
Utz Brands, Inc. (UTZ) Bundle
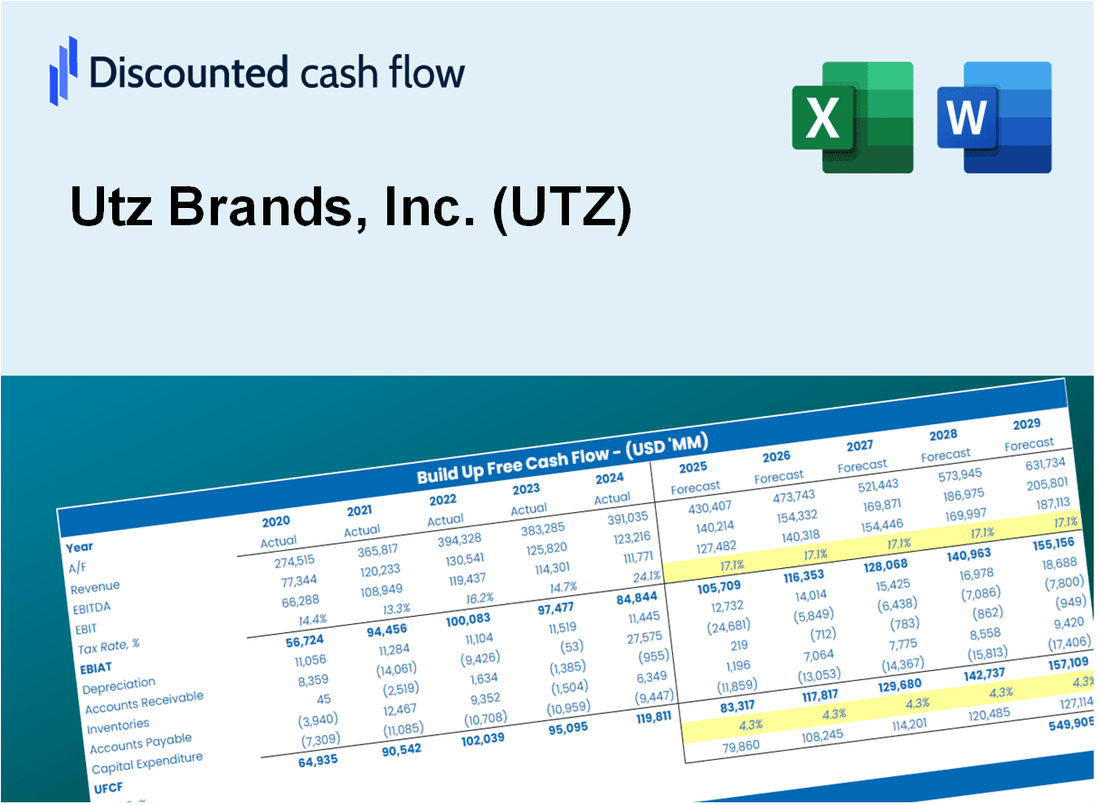
Avalie as perspectivas financeiras da Utz Brands, Inc. (UTZ) como um especialista! Esta calculadora DCF (UTZ) vem com dados financeiros pré-preenchidos e oferece flexibilidade total para modificar o crescimento da receita, o WACC, as margens e outras suposições cruciais para se alinhar com suas projeções.
Discounted Cash Flow (DCF) - (USD MM)
| Year | AY1 2020 |
AY2 2021 |
AY3 2022 |
AY4 2023 |
AY5 2024 |
FY1 2025 |
FY2 2026 |
FY3 2027 |
FY4 2028 |
FY5 2029 |
|---|---|---|---|---|---|---|---|---|---|---|
| Revenue | 964.3 | 1,180.7 | 1,408.4 | 1,438.2 | 1,409.3 | 1,556.7 | 1,719.4 | 1,899.3 | 2,097.9 | 2,317.3 |
| Revenue Growth, % | 0 | 22.44 | 19.28 | 2.12 | -2.01 | 10.46 | 10.46 | 10.46 | 10.46 | 10.46 |
| EBITDA | 85.8 | 127.7 | 91.3 | 99.2 | 182.1 | 143.3 | 158.2 | 174.8 | 193.1 | 213.3 |
| EBITDA, % | 8.89 | 10.81 | 6.48 | 6.9 | 12.92 | 9.2 | 9.2 | 9.2 | 9.2 | 9.2 |
| Depreciation | 44.7 | 80.7 | 86.8 | 79.5 | 70.9 | 87.8 | 97.0 | 107.1 | 118.3 | 130.7 |
| Depreciation, % | 4.64 | 6.84 | 6.16 | 5.53 | 5.03 | 5.64 | 5.64 | 5.64 | 5.64 | 5.64 |
| EBIT | 41.0 | 46.9 | 4.5 | 19.8 | 111.2 | 55.5 | 61.3 | 67.7 | 74.7 | 82.6 |
| EBIT, % | 4.25 | 3.98 | 0.32171 | 1.37 | 7.89 | 3.56 | 3.56 | 3.56 | 3.56 | 3.56 |
| Total Cash | 46.8 | 41.9 | 72.9 | 52.0 | 56.1 | 66.0 | 72.8 | 80.5 | 88.9 | 98.2 |
| Total Cash, percent | .0 | .0 | .0 | .0 | .0 | .0 | .0 | .0 | .0 | .0 |
| Account Receivables | 126.0 | 138.1 | 146.3 | 140.4 | 124.5 | 167.3 | 184.8 | 204.1 | 225.5 | 249.0 |
| Account Receivables, % | 13.06 | 11.7 | 10.38 | 9.76 | 8.83 | 10.75 | 10.75 | 10.75 | 10.75 | 10.75 |
| Inventories | 59.8 | 79.5 | 118.0 | 104.7 | 101.4 | 111.4 | 123.1 | 135.9 | 150.1 | 165.8 |
| Inventories, % | 6.2 | 6.73 | 8.38 | 7.28 | 7.19 | 7.16 | 7.16 | 7.16 | 7.16 | 7.16 |
| Accounts Payable | 57.3 | 95.4 | 114.4 | 124.4 | 150.9 | 129.2 | 142.7 | 157.6 | 174.1 | 192.3 |
| Accounts Payable, % | 5.94 | 8.08 | 8.12 | 8.65 | 10.71 | 8.3 | 8.3 | 8.3 | 8.3 | 8.3 |
| Capital Expenditure | -20.0 | -33.5 | -88.0 | -55.7 | -98.6 | -68.6 | -75.8 | -83.7 | -92.4 | -102.1 |
| Capital Expenditure, % | -2.07 | -2.84 | -6.25 | -3.87 | -7 | -4.41 | -4.41 | -4.41 | -4.41 | -4.41 |
| Tax Rate, % | 77 | 77 | 77 | 77 | 77 | 77 | 77 | 77 | 77 | 77 |
| EBITAT | 39.3 | 60.0 | .0 | 12.5 | 25.6 | 31.4 | 34.7 | 38.3 | 42.3 | 46.8 |
| Depreciation | ||||||||||
| Changes in Account Receivables | ||||||||||
| Changes in Inventories | ||||||||||
| Changes in Accounts Payable | ||||||||||
| Capital Expenditure | ||||||||||
| UFCF | -64.5 | 113.5 | -28.8 | 65.5 | 43.6 | -24.0 | 40.3 | 44.5 | 49.2 | 54.3 |
| WACC, % | 6.31 | 6.41 | 4 | 5.52 | 4.53 | 5.36 | 5.36 | 5.36 | 5.36 | 5.36 |
| PV UFCF | ||||||||||
| SUM PV UFCF | 133.3 | |||||||||
| Long Term Growth Rate, % | 2.00 | |||||||||
| Free cash flow (T + 1) | 55 | |||||||||
| Terminal Value | 1,650 | |||||||||
| Present Terminal Value | 1,271 | |||||||||
| Enterprise Value | 1,405 | |||||||||
| Net Debt | 885 | |||||||||
| Equity Value | 520 | |||||||||
| Diluted Shares Outstanding, MM | 85 | |||||||||
| Equity Value Per Share | 6.09 |
What You Will Get
- Real Utz Data: Preloaded financials – from revenue to EBIT – based on actual and projected figures for Utz Brands, Inc. (UTZ).
- Full Customization: Adjust all critical parameters (yellow cells) such as WACC, growth %, and tax rates to suit your analysis.
- Instant Valuation Updates: Automatic recalculations to assess the impact of changes on Utz’s fair value.
- Versatile Excel Template: Designed for quick edits, scenario testing, and comprehensive projections.
- Time-Saving and Accurate: Avoid the hassle of building models from scratch while ensuring precision and flexibility.
Key Features
- 🔍 Real-Life UTZ Financials: Pre-filled historical and projected data for Utz Brands, Inc. (UTZ).
- ✏️ Fully Customizable Inputs: Adjust all critical parameters (yellow cells) like WACC, growth %, and tax rates.
- 📊 Professional DCF Valuation: Built-in formulas calculate Utz’s intrinsic value using the Discounted Cash Flow method.
- ⚡ Instant Results: Visualize Utz’s valuation instantly after making changes.
- Scenario Analysis: Test and compare outcomes for various financial assumptions side-by-side.
How It Works
- Download: Get the pre-formatted Excel file containing Utz Brands, Inc. (UTZ) financial data.
- Customize: Modify projections such as revenue growth, EBITDA %, and WACC as needed.
- Update Automatically: Watch the intrinsic value and NPV calculations refresh in real-time.
- Test Scenarios: Generate various projections and instantly compare the results.
- Make Decisions: Leverage the valuation insights to inform your investment choices.
Why Choose Utz Brands, Inc. (UTZ)?
- Save Time: Quickly access essential information without the need for extensive research.
- Enhance Quality: High-quality ingredients ensure superior taste and satisfaction.
- Fully Customizable: Choose from a variety of products to meet your snacking preferences.
- Easy to Enjoy: Convenient packaging makes snacking on the go effortless.
- Trusted by Consumers: A brand known for its commitment to excellence and customer satisfaction.
Who Should Use This Product?
- Investors: Evaluate Utz Brands, Inc. (UTZ) valuation before making investment decisions.
- CFOs and Financial Analysts: Optimize valuation methodologies and assess financial forecasts.
- Startup Founders: Understand the valuation strategies of established brands like Utz.
- Consultants: Provide comprehensive valuation analyses and reports for clients.
- Students and Educators: Utilize current data to teach and learn valuation practices.
What the Template Contains
- Historical Data: Includes Utz Brands, Inc.'s (UTZ) past financials and baseline forecasts.
- DCF and Levered DCF Models: Detailed templates to calculate Utz Brands, Inc.'s (UTZ) intrinsic value.
- WACC Sheet: Pre-built calculations for Weighted Average Cost of Capital.
- Editable Inputs: Modify key drivers like growth rates, EBITDA %, and CAPEX assumptions.
- Quarterly and Annual Statements: A complete breakdown of Utz Brands, Inc.'s (UTZ) financials.
- Interactive Dashboard: Visualize valuation results and projections dynamically.
Disclaimer
All information, articles, and product details provided on this website are for general informational and educational purposes only. We do not claim any ownership over, nor do we intend to infringe upon, any trademarks, copyrights, logos, brand names, or other intellectual property mentioned or depicted on this site. Such intellectual property remains the property of its respective owners, and any references here are made solely for identification or informational purposes, without implying any affiliation, endorsement, or partnership.
We make no representations or warranties, express or implied, regarding the accuracy, completeness, or suitability of any content or products presented. Nothing on this website should be construed as legal, tax, investment, financial, medical, or other professional advice. In addition, no part of this site—including articles or product references—constitutes a solicitation, recommendation, endorsement, advertisement, or offer to buy or sell any securities, franchises, or other financial instruments, particularly in jurisdictions where such activity would be unlawful.
All content is of a general nature and may not address the specific circumstances of any individual or entity. It is not a substitute for professional advice or services. Any actions you take based on the information provided here are strictly at your own risk. You accept full responsibility for any decisions or outcomes arising from your use of this website and agree to release us from any liability in connection with your use of, or reliance upon, the content or products found herein.