
|
Virtus Investment Partners, Inc. (VRTS) Avaliação DCF |
Totalmente Editável: Adapte-Se Às Suas Necessidades No Excel Ou Planilhas
Design Profissional: Modelos Confiáveis E Padrão Da Indústria
Pré-Construídos Para Uso Rápido E Eficiente
Compatível com MAC/PC, totalmente desbloqueado
Não É Necessária Experiência; Fácil De Seguir
Virtus Investment Partners, Inc. (VRTS) Bundle
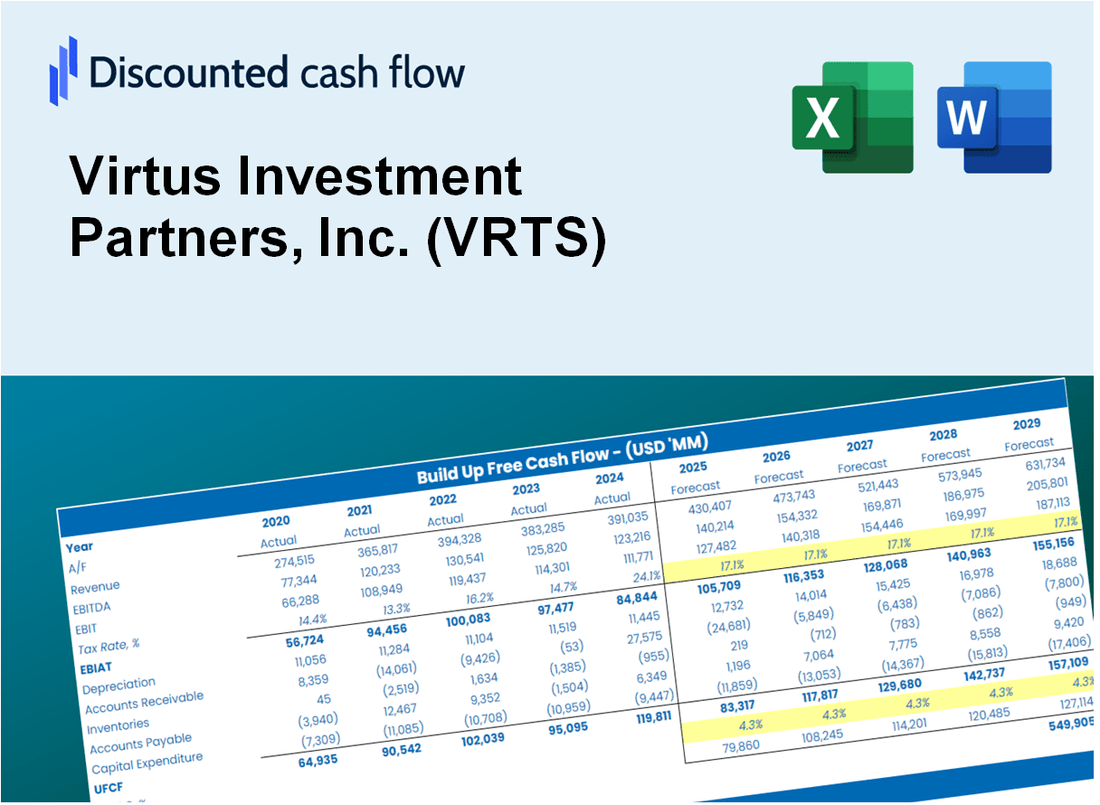
Como investidor ou analista, esta calculadora DCF (VRTS) é o seu recurso preferido para uma avaliação precisa. Equipado com dados reais da Virtus Investment Partners, Inc., você pode ajustar as previsões e ver imediatamente os efeitos.
Discounted Cash Flow (DCF) - (USD MM)
| Year | AY1 2020 |
AY2 2021 |
AY3 2022 |
AY4 2023 |
AY5 2024 |
FY1 2025 |
FY2 2026 |
FY3 2027 |
FY4 2028 |
FY5 2029 |
|---|---|---|---|---|---|---|---|---|---|---|
| Revenue | 603.2 | 974.7 | 881.7 | 841.5 | 902.8 | 1,026.4 | 1,167.0 | 1,326.7 | 1,508.4 | 1,714.9 |
| Revenue Growth, % | 0 | 61.58 | -9.54 | -4.56 | 7.29 | 13.69 | 13.69 | 13.69 | 13.69 | 13.69 |
| EBITDA | 300.1 | 474.1 | 321.5 | 433.8 | 460.2 | 487.3 | 554.0 | 629.9 | 716.1 | 814.1 |
| EBITDA, % | 49.75 | 48.64 | 36.46 | 51.55 | 50.97 | 47.47 | 47.47 | 47.47 | 47.47 | 47.47 |
| Depreciation | 38.9 | 50.8 | 64.2 | 68.4 | 69.0 | 71.3 | 81.0 | 92.1 | 104.7 | 119.0 |
| Depreciation, % | 6.44 | 5.21 | 7.28 | 8.13 | 7.64 | 6.94 | 6.94 | 6.94 | 6.94 | 6.94 |
| EBIT | 261.2 | 423.3 | 257.3 | 365.3 | 391.2 | 416.0 | 473.0 | 537.8 | 611.4 | 695.1 |
| EBIT, % | 43.31 | 43.43 | 29.18 | 43.41 | 43.33 | 40.53 | 40.53 | 40.53 | 40.53 | 40.53 |
| Total Cash | 333.5 | 585.5 | 588.5 | 340.3 | 399.6 | 547.7 | 622.7 | 708.0 | 804.9 | 915.1 |
| Total Cash, percent | .0 | .0 | .0 | .0 | .0 | .0 | .0 | .0 | .0 | .0 |
| Account Receivables | 84.5 | 123.9 | 99.3 | 109.1 | 117.2 | 131.2 | 149.2 | 169.6 | 192.8 | 219.2 |
| Account Receivables, % | 14.01 | 12.71 | 11.26 | 12.96 | 12.98 | 12.78 | 12.78 | 12.78 | 12.78 | 12.78 |
| Inventories | .0 | .0 | 250.9 | .0 | .0 | 58.4 | 66.4 | 75.5 | 85.9 | 97.6 |
| Inventories, % | 0 | 0 | 28.46 | 0 | 0 | 5.69 | 5.69 | 5.69 | 5.69 | 5.69 |
| Accounts Payable | 25.4 | 48.5 | 33.2 | 38.8 | 49.5 | 47.3 | 53.8 | 61.1 | 69.5 | 79.0 |
| Accounts Payable, % | 4.2 | 4.98 | 3.77 | 4.61 | 5.48 | 4.61 | 4.61 | 4.61 | 4.61 | 4.61 |
| Capital Expenditure | -1.0 | -5.8 | -6.6 | -8.8 | -5.6 | -6.5 | -7.4 | -8.5 | -9.6 | -10.9 |
| Capital Expenditure, % | -0.1729 | -0.59897 | -0.7465 | -1.05 | -0.61796 | -0.63692 | -0.63692 | -0.63692 | -0.63692 | -0.63692 |
| Tax Rate, % | 41.43 | 41.43 | 41.43 | 41.43 | 41.43 | 41.43 | 41.43 | 41.43 | 41.43 | 41.43 |
| EBITAT | 127.4 | 249.1 | 184.5 | 255.8 | 229.1 | 256.2 | 291.3 | 331.2 | 376.5 | 428.1 |
| Depreciation | ||||||||||
| Changes in Account Receivables | ||||||||||
| Changes in Inventories | ||||||||||
| Changes in Accounts Payable | ||||||||||
| Capital Expenditure | ||||||||||
| UFCF | 106.1 | 277.8 | .5 | 562.1 | 295.1 | 246.3 | 345.4 | 392.7 | 446.4 | 507.6 |
| WACC, % | 5.94 | 6.45 | 7.1 | 7.01 | 6.43 | 6.59 | 6.59 | 6.59 | 6.59 | 6.59 |
| PV UFCF | ||||||||||
| SUM PV UFCF | 1,574.3 | |||||||||
| Long Term Growth Rate, % | 2.00 | |||||||||
| Free cash flow (T + 1) | 518 | |||||||||
| Terminal Value | 11,291 | |||||||||
| Present Terminal Value | 8,208 | |||||||||
| Enterprise Value | 9,782 | |||||||||
| Net Debt | 2,075 | |||||||||
| Equity Value | 7,708 | |||||||||
| Diluted Shares Outstanding, MM | 7 | |||||||||
| Equity Value Per Share | 1,069.01 |
What You Will Receive
- Flexible Forecast Inputs: Effortlessly adjust assumptions (growth %, margins, WACC) to explore various scenarios.
- Comprehensive Data: Virtus Investment Partners, Inc.'s (VRTS) financial information pre-loaded to streamline your analysis.
- Instant DCF Outputs: The template automatically computes Net Present Value (NPV) and intrinsic value for your convenience.
- Tailored and Professional: A refined Excel model that can be customized to suit your valuation requirements.
- Designed for Analysts and Investors: Perfect for evaluating projections, confirming strategies, and enhancing efficiency.
Key Features
- Customizable Investment Metrics: Adjust essential inputs such as asset allocation, risk tolerance, and expected returns.
- Real-Time Performance Analytics: Provides instant insights into portfolio performance and risk assessment.
- Institutional-Grade Precision: Leverages Virtus Investment Partners' robust financial data for reliable investment evaluations.
- Effortless Scenario Simulation: Explore various market conditions and assess potential impacts on investment strategies.
- Efficiency-Boosting Solution: Streamline the investment analysis process without starting from the ground up.
How It Works
- Step 1: Download the Excel file for Virtus Investment Partners, Inc. (VRTS).
- Step 2: Review pre-entered data on Virtus (historical and projected).
- Step 3: Adjust key assumptions (yellow cells) based on your analysis.
- Step 4: Observe automatic recalculations for Virtus’s intrinsic value.
- Step 5: Utilize the outputs for investment decisions or reporting.
Why Choose This Calculator for Virtus Investment Partners, Inc. (VRTS)?
- All-in-One Solution: Integrates DCF, WACC, and financial ratio analyses seamlessly.
- Flexible Inputs: Modify the highlighted cells to explore different investment scenarios.
- In-Depth Analysis: Automatically computes Virtus Investment Partners' intrinsic value and Net Present Value.
- Preloaded Information: Access to historical and projected data for reliable analysis.
- Expert Level: Perfect for financial analysts, investors, and business advisors.
Who Should Use This Product?
- Finance Students: Explore investment strategies and apply them using real market data for Virtus Investment Partners, Inc. (VRTS).
- Academics: Integrate advanced financial models into your studies or research projects focused on investment management.
- Investors: Validate your investment hypotheses and evaluate performance metrics for Virtus Investment Partners, Inc. (VRTS).
- Analysts: Enhance your analysis process with a ready-to-use, customizable financial model tailored for Virtus Investment Partners, Inc. (VRTS).
- Small Business Owners: Understand the evaluation processes used for large investment firms like Virtus Investment Partners, Inc. (VRTS).
What the Template Contains
- Operating and Balance Sheet Data: Pre-filled Virtus Investment Partners, Inc. (VRTS) historical data and forecasts, including revenue, EBITDA, EBIT, and capital expenditures.
- WACC Calculation: A dedicated sheet for Weighted Average Cost of Capital (WACC), including parameters like Beta, risk-free rate, and share price.
- DCF Valuation (Unlevered and Levered): Editable Discounted Cash Flow models showing intrinsic value with detailed calculations.
- Financial Statements: Pre-loaded financial statements (annual and quarterly) to support analysis.
- Key Ratios: Includes profitability, leverage, and efficiency ratios for Virtus Investment Partners, Inc. (VRTS).
- Dashboard and Charts: Visual summary of valuation outputs and assumptions to analyze results easily.
Disclaimer
All information, articles, and product details provided on this website are for general informational and educational purposes only. We do not claim any ownership over, nor do we intend to infringe upon, any trademarks, copyrights, logos, brand names, or other intellectual property mentioned or depicted on this site. Such intellectual property remains the property of its respective owners, and any references here are made solely for identification or informational purposes, without implying any affiliation, endorsement, or partnership.
We make no representations or warranties, express or implied, regarding the accuracy, completeness, or suitability of any content or products presented. Nothing on this website should be construed as legal, tax, investment, financial, medical, or other professional advice. In addition, no part of this site—including articles or product references—constitutes a solicitation, recommendation, endorsement, advertisement, or offer to buy or sell any securities, franchises, or other financial instruments, particularly in jurisdictions where such activity would be unlawful.
All content is of a general nature and may not address the specific circumstances of any individual or entity. It is not a substitute for professional advice or services. Any actions you take based on the information provided here are strictly at your own risk. You accept full responsibility for any decisions or outcomes arising from your use of this website and agree to release us from any liability in connection with your use of, or reliance upon, the content or products found herein.