
|
Weis Markets, Inc. (WMK) Avaliação DCF |
Totalmente Editável: Adapte-Se Às Suas Necessidades No Excel Ou Planilhas
Design Profissional: Modelos Confiáveis E Padrão Da Indústria
Pré-Construídos Para Uso Rápido E Eficiente
Compatível com MAC/PC, totalmente desbloqueado
Não É Necessária Experiência; Fácil De Seguir
Weis Markets, Inc. (WMK) Bundle
Avalie as perspectivas financeiras da Weis Markets, Inc. como um especialista! Essa calculadora DCF (WMK) fornece dados financeiros pré-preenchidos, juntamente com a máxima flexibilidade para modificar o crescimento da receita, o WACC, as margens e outras suposições essenciais para se alinhar às suas projeções.
What You Will Get
- Pre-Filled Financial Model: Weis Markets’ actual data enables precise DCF valuation.
- Full Forecast Control: Adjust revenue growth, margins, WACC, and other key drivers.
- Instant Calculations: Automatic updates ensure you see results as you make changes.
- Investor-Ready Template: A refined Excel file designed for professional-grade valuation.
- Customizable and Reusable: Tailored for flexibility, allowing repeated use for detailed forecasts.
Key Features
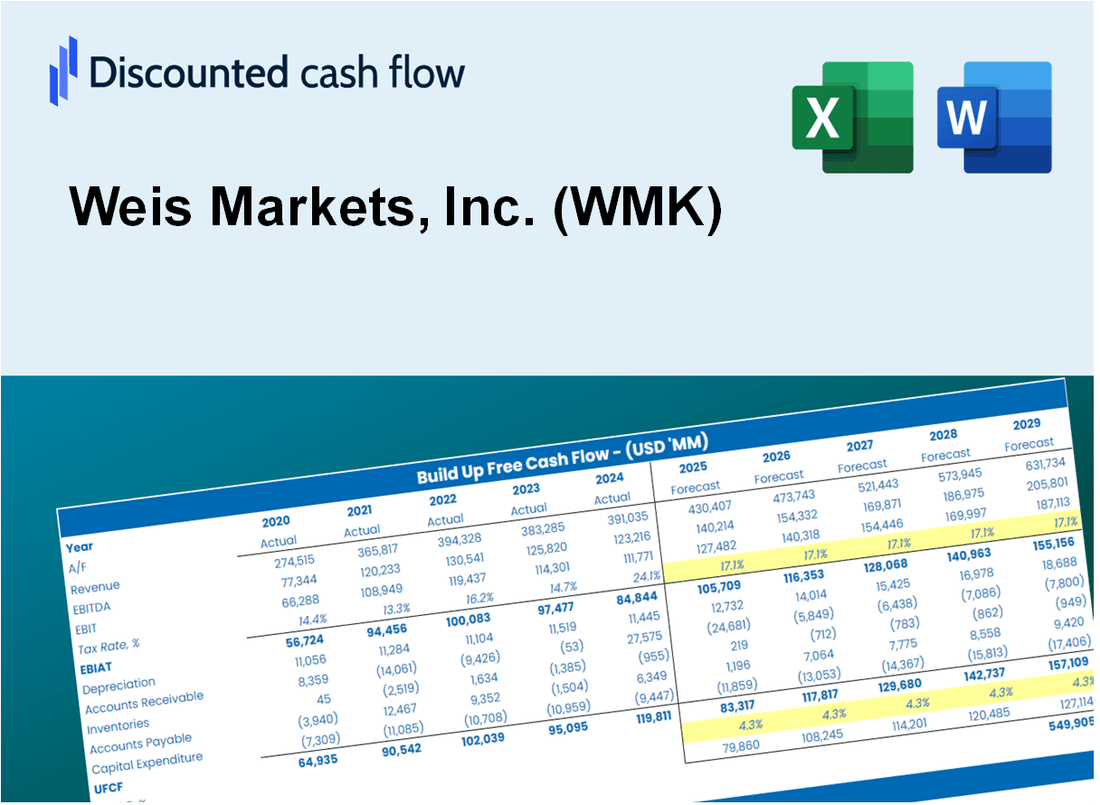
- Comprehensive Financial Data: Weis Markets, Inc.'s (WMK) historical financial statements and detailed forecasts.
- Customizable Parameters: Modify WACC, tax rates, revenue growth, and EBITDA margins to suit your analysis.
- Real-Time Valuation: Observe the intrinsic value of Weis Markets, Inc. (WMK) update instantly.
- Intuitive Visualizations: Engaging dashboard charts illustrate valuation outcomes and essential metrics.
- Designed for Precision: A reliable tool tailored for analysts, investors, and finance professionals.
How It Works
- Step 1: Download the prebuilt Excel template with Weis Markets, Inc. (WMK) data included.
- Step 2: Explore the pre-filled sheets and familiarize yourself with the key metrics.
- Step 3: Update forecasts and assumptions in the editable yellow cells (WACC, growth, margins).
- Step 4: Instantly view recalculated results, including Weis Markets, Inc. (WMK)'s intrinsic value.
- Step 5: Make informed investment decisions or generate reports using the outputs.
Why Choose This Calculator?
- Designed for Experts: A sophisticated tool utilized by financial analysts, CFOs, and industry consultants.
- Up-to-Date Data: Weis Markets, Inc. (WMK) historical and projected financials included for reliable insights.
- What-If Analysis: Effortlessly test various scenarios and assumptions.
- Concise Results: Automatically computes intrinsic value, NPV, and essential financial metrics.
- User-Friendly: Comprehensive step-by-step guidance to assist you throughout the process.
Who Should Use Weis Markets, Inc. (WMK)?
- Investors: Gain insights into the grocery retail sector with comprehensive market analysis.
- Financial Analysts: Utilize detailed financial reports to enhance your market assessments.
- Consultants: Tailor reports and presentations using data-driven insights from Weis Markets, Inc. (WMK).
- Retail Enthusiasts: Explore the operational strategies of a leading grocery chain through case studies.
- Educators and Students: Apply real-world examples in coursework related to retail management and finance.
What the Template Contains
- Pre-Filled DCF Model: Weis Markets, Inc.'s (WMK) financial data preloaded for immediate use.
- WACC Calculator: Detailed calculations for Weighted Average Cost of Capital.
- Financial Ratios: Evaluate Weis Markets, Inc.'s (WMK) profitability, leverage, and efficiency.
- Editable Inputs: Change assumptions such as growth, margins, and CAPEX to fit your scenarios.
- Financial Statements: Annual and quarterly reports to support detailed analysis.
- Interactive Dashboard: Easily visualize key valuation metrics and results.
Disclaimer
All information, articles, and product details provided on this website are for general informational and educational purposes only. We do not claim any ownership over, nor do we intend to infringe upon, any trademarks, copyrights, logos, brand names, or other intellectual property mentioned or depicted on this site. Such intellectual property remains the property of its respective owners, and any references here are made solely for identification or informational purposes, without implying any affiliation, endorsement, or partnership.
We make no representations or warranties, express or implied, regarding the accuracy, completeness, or suitability of any content or products presented. Nothing on this website should be construed as legal, tax, investment, financial, medical, or other professional advice. In addition, no part of this site—including articles or product references—constitutes a solicitation, recommendation, endorsement, advertisement, or offer to buy or sell any securities, franchises, or other financial instruments, particularly in jurisdictions where such activity would be unlawful.
All content is of a general nature and may not address the specific circumstances of any individual or entity. It is not a substitute for professional advice or services. Any actions you take based on the information provided here are strictly at your own risk. You accept full responsibility for any decisions or outcomes arising from your use of this website and agree to release us from any liability in connection with your use of, or reliance upon, the content or products found herein.