
|
Petco Health and Wellness Company, Inc. (Woof): 5 forças Análise [Jan-2025 Atualizada] |
Totalmente Editável: Adapte-Se Às Suas Necessidades No Excel Ou Planilhas
Design Profissional: Modelos Confiáveis E Padrão Da Indústria
Pré-Construídos Para Uso Rápido E Eficiente
Compatível com MAC/PC, totalmente desbloqueado
Não É Necessária Experiência; Fácil De Seguir
Petco Health and Wellness Company, Inc. (WOOF) Bundle
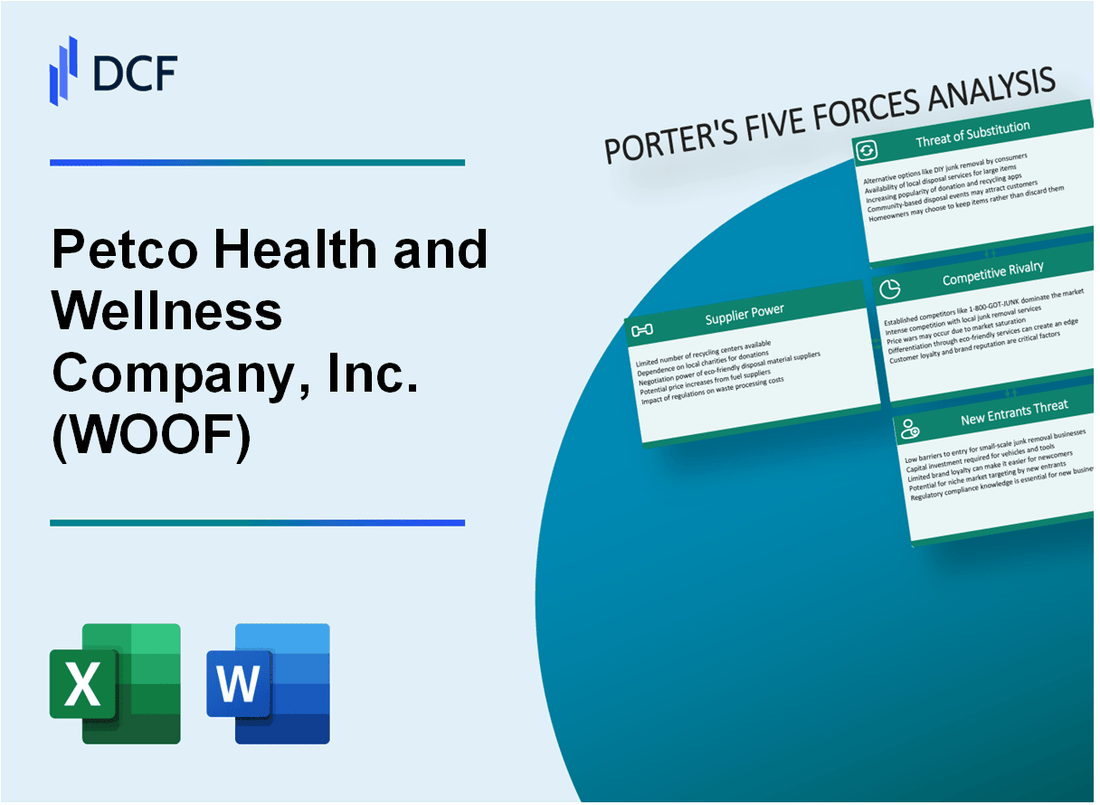
No mundo dinâmico do varejo de cuidados com animais de estimação, a PetCo Health and Wellness Company, Inc. (Woof) navega em um cenário competitivo complexo moldado pelas cinco forças de Michael Porter. Desde que lutem contra a intensa rivalidade do mercado até o gerenciamento de relacionamentos com fornecedores e expectativas dos clientes, a empresa enfrenta um desafio multifacetado na manutenção de sua posição de mercado. Com US $ 6,3 bilhões Na receita anual e na abordagem estratégica do bem -estar dos animais de estimação, a PETCO deve se adaptar continuamente à mudança de dinâmica do mercado, interrupções tecnológicas e preferências em evolução do consumidor no ecossistema altamente competitivo de cuidados com animais.
PETCO Health and Wellness Company, Inc. (Woof) - As cinco forças de Porter: poder de barganha dos fornecedores
Paisagem dos fabricantes de alimentos e suprimentos para animais de estimação
A partir de 2024, o mercado de suprimentos para animais de estimação mostra uma concentração significativa entre os principais fabricantes:
| Fornecedor | Quota de mercado | Receita anual |
|---|---|---|
| Mars Petcare | 29.4% | US $ 19,3 bilhões |
| Purina (Nestlé) | 24.7% | US $ 16,8 bilhões |
| Nutrição de animais de estimação de Hill | 12.5% | US $ 8,2 bilhões |
Análise de dependência do fornecedor
As principais dependências do fornecedor para PETCO incluem:
- Mars PetCare fornece 35,6% do inventário de alimentos para animais de estimação da Petco
- Purina fornece 28,3% do total de linhas de produtos
- Hill's Pet Nutrition contribui com 15,2% dos produtos nutricionais especializados
Estratégias de produtos exclusivos e de marca própria
As métricas de concentração de fornecedores revelam:
- 42,7% dos fornecedores oferecem linhas de produtos exclusivas
- 27,5% desenvolveram parcerias de marca própria com a PETCO
- 18,9% mantêm controle de distribuição estrita
Potencial de integração vertical
Recursos de integração vertical de grandes fornecedores:
| Fornecedor | Potencial de integração vertical | Presença direta no varejo |
|---|---|---|
| Mars Petcare | Alto | 36 locais de varejo |
| Purina | Médio | 12 locais de varejo |
| Nutrição de animais de estimação de Hill | Baixo | 4 locais de varejo |
PETCO Health and Wellness Company, Inc. (Woof) - As cinco forças de Porter: poder de barganha dos clientes
Baixos custos de comutação para os donos de animais entre varejistas
De acordo com um relatório da indústria de animais de estimação de 2023, 68% dos proprietários de animais comparam regularmente os preços em vários varejistas. O proprietário médio de animais de estimação visita 3,2 lojas diferentes de suprimentos de animais ou plataformas on -line anualmente.
| Tipo de varejista | Quota de mercado | Taxa média de troca de clientes |
|---|---|---|
| Grandes cadeias de lojas de animais | 42% | 57% |
| Varejistas de animais online | 28% | 63% |
| Lojas de animais locais | 18% | 45% |
Alta sensibilidade ao preço em produtos para cuidados com animais de estimação
A pesquisa de consumidores de 2023 indica que 72% dos proprietários de animais buscam ativamente descontos e promoções ao comprar produtos para animais de estimação.
- Tolerância média à diferença de preço: US $ 5 a US $ 10 por produto
- 72% dos consumidores comparam os preços antes de comprar
- 45% de troca de varejistas para obter melhores preços
Crescente preferência do consumidor por compras online e omnichannel
As vendas de produtos para animais de estimação com comércio eletrônico atingiram US $ 27,5 bilhões em 2023, representando 38% do total de vendas de produtos para animais de estimação.
| Canal de compras | Quota de mercado | Taxa de crescimento |
|---|---|---|
| Plataformas online | 38% | 14.5% |
| Lojas físicas | 52% | 6.2% |
| Híbrido/omnichannel | 10% | 22.3% |
Crescente demanda por produtos PET premium e focados na saúde
O segmento de produtos para animais de estimação premium cresceu 16,7% em 2023, com os consumidores gastando uma média de US $ 87 mensalmente em produtos especializados em saúde para animais de estimação.
Programas de fidelidade para mitigar o poder de barganha do cliente
O programa de fidelidade da Petco inclui 22 milhões de membros ativos, representando 45% de sua base de clientes.
- Gastes médios do programa de fidelidade: US $ 423 anualmente
- Taxa de retenção de membros: 68%
- Repita a taxa de compra para membros de fidelidade: 73%
Petco Health and Wellness Company, Inc. (Woof) - Five Forces de Porter: rivalidade competitiva
Cenário intenso da competição
A partir do quarto trimestre 2023, a Petco enfrenta uma rivalidade competitiva significativa dos principais players do mercado:
| Concorrente | Quota de mercado | Receita anual |
|---|---|---|
| PetSmart | 22.3% | US $ 9,3 bilhões |
| Chewy | 15.7% | US $ 8,9 bilhões |
| Amazon Pet | 12.5% | US $ 6,7 bilhões |
| Petco | 18.6% | US $ 6,1 bilhões |
Análise de fragmentação do mercado
O mercado de suprimentos para animais de estimação demonstra fragmentação significativa:
- Mais de 500 lojas de suprimentos regionais e locais
- Aproximadamente 35% do mercado mantido por varejistas independentes
- Segmento de suprimento de animais on -line crescendo em 18,2% anualmente
Concurso de preços e serviços
Métricas competitivas para 2023-2024:
| Métrica competitiva | Petco Performance |
|---|---|
| Desconto médio do produto | 12-15% |
| Combinação de preços on -line | 98% de conformidade |
| Limite de frete grátis | Pedidos acima de US $ 49 |
Diferenciação veterinária e de bem -estar
Repartição do mercado de serviços veterinários:
- A PETCO opera mais de 600 hospitais veterinários
- Receita anual de serviço veterinário: US $ 742 milhões
- Associação do Programa de Bem -Estar: 3,2 milhões de clientes
Expansão de presença no varejo
Distribuição de canais de varejo para 2024:
| Canal | Número de locais | Porcentagem de vendas |
|---|---|---|
| Lojas físicas | 1,500 | 62% |
| Plataforma online | Marketplace digital | 38% |
PETCO Health and Wellness Company, Inc. (Woof) - As cinco forças de Porter: ameaça de substitutos
Mercados on -line que oferecem suprimentos para animais de estimação
A participação de mercado de suprimentos para animais de estimação da Amazon atingiu 47% em 2023. Chewy.com gerou US $ 9,95 bilhões em vendas líquidas em 2022, representando um aumento de 12,7% em relação ao ano anterior. As vendas de suprimentos para animais de estimação do Walmart.com aumentaram 22% em 2023.
| Mercado on -line | Quota de mercado | Vendas anuais |
|---|---|---|
| Amazon | 47% | US $ 15,3 bilhões |
| Chewy.com | 18% | US $ 9,95 bilhões |
| Walmart.com | 12% | US $ 6,7 bilhões |
Cuidados com animais de estimação DIY e alternativas caseiras de alimentos para animais de estimação
O mercado caseiro de alimentos para animais de estimação cresceu 18,5% em 2023. 32% dos donos de animais de estimação relataram preparar regularmente as refeições caseiras.
- Gastos mensais médios em comida caseira de animais de estimação: $ 87
- DIY Valor de mercado de ingredientes alimentares para animais de estimação: US $ 2,3 bilhões
- As pesquisas on -line de receitas de alimentos para animais de estimação aumentaram 45% em 2023
Clínicas veterinárias que fornecem produtos especializados em saúde para animais de estimação
As clínicas veterinárias geraram US $ 33,6 bilhões em vendas de produtos em 2022. 64% das clínicas veterinárias oferecem vendas diretas de produtos aos proprietários de animais.
| Categoria de produto | Volume de vendas | Porcentagem de mercado |
|---|---|---|
| Medicamentos prescritos | US $ 12,4 bilhões | 37% |
| Suplementos nutricionais | US $ 8,7 bilhões | 26% |
| Produtos de cuidados preventivos | US $ 6,5 bilhões | 19% |
Marcas de produtos para animais de estimação direta ao consumidor emergentes
As marcas de animais de estimação direta ao consumidor capturaram 8,3% do mercado em 2023. As vendas totais atingiram US $ 4,2 bilhões.
- Número de novas marcas de animais de estimação DTC lançadas: 87
- Financiamento médio por marca de animais de estimação DTC: US $ 3,6 milhões
- Taxa on -line de conversão de produtos para animais de estimação DTC: 6,4%
Potencial para substitutos gerados pelo consumidor
Alternativas de produtos para animais de estimação gerados pelo consumidor representavam 5,7% do mercado total de suprimentos para animais de estimação em 2023. Valor total de mercado de substitutos gerados pelo consumidor: US $ 2,1 bilhões.
| Tipo substituto | Quota de mercado | Crescimento anual |
|---|---|---|
| Acessórios artesanais para animais de estimação | 2.3% | 17.6% |
| Nutrição personalizada para animais de estimação | 1.8% | 22.4% |
| Serviços para animais de estimação ponto a ponto | 1.6% | 15.3% |
PETCO Health and Wellness Company, Inc. (Woof) - As cinco forças de Porter: ameaça de novos participantes
Altos requisitos de capital inicial para infraestrutura de varejo para animais de estimação
A PETCO requer investimento inicial substancial, com 2023 ativos totais de US $ 2,56 bilhões e propriedades, plantas e equipamentos avaliados em US $ 522,7 milhões. Os custos típicos de configuração da loja variam de US $ 500.000 a US $ 1,2 milhão por local.
Lealdade à marca estabelecida no mercado de cuidados com animais de estimação
| Métrica | Valor |
|---|---|
| Participação de mercado da PETCO | 16.8% |
| Taxa de retenção de clientes | 68.3% |
| Visitas anuais de clientes | 7,2 vezes por ano |
Padrões regulatórios de conformidade e qualidade
Custos de conformidade: Estimado em US $ 3,4 milhões anualmente para o setor de varejo para animais de estimação.
- Regulamentos de segurança alimentar da FDA Pet
- Diretrizes de bem -estar animal do USDA
- Requisitos de licenciamento de varejo para animais de estimação específicos do estado
Investimentos de tecnologia e plataforma digital
Custos de desenvolvimento da plataforma digital: US $ 42,5 milhões em 2023, representando 3,2% da receita total.
Economias de escala
| Métrica de escala | Valor Petco |
|---|---|
| Total de lojas | 1,500 |
| Receita anual | US $ 4,6 bilhões |
| Custo por unidade de redução | 12.7% |
Petco Health and Wellness Company, Inc. (WOOF) - Porter's Five Forces: Competitive rivalry
The competitive rivalry within the pet retail space for Petco Health and Wellness Company, Inc. (WOOF) is definitely intense; you see it reflected in the financial results every quarter. The pressure comes from multiple angles, but the digital-first pure-play competitor, Chewy.com, remains the most significant headwind in the online channel.
To illustrate the scale difference in digital reach as of mid-2025, consider the web traffic metrics from Q1 2025. Chewy.com consistently attracted over 25M unique visitors monthly, while petco.com ranged between 7M and 8M unique visitors. This gap in top-of-funnel digital engagement translates to market share; Chewy commands an estimated 33% share of the total online pet segment. Petco Health and Wellness Company, Inc. is actively working to close this gap, reporting 9% digital growth in Q1 2025, though its Q3 2025 net sales were $1.5 billion. Chewy, by comparison, reported Q2 2025 net sales of $3.10 billion.
The rivalry isn't just digital; the physical footprint competition with PetSmart is also a major factor. PetSmart is the larger player by store count, operating 1,660+ stores compared to Petco's over 1,500 locations across the U.S. and Puerto Rico. This scale advantage shows up in foot traffic data from early 2024, where PetSmart drew 62.1% of the total traffic between the two chains. Furthermore, PetSmart customers showed higher repeat visitation, with 21.1% to 21.8% visiting at least twice monthly, versus 18.1% to 19.0% for Petco Health and Wellness Company, Inc. visitors.
Mass-market retailers, especially Amazon, leverage their sheer scale and low-price positioning to exert pressure across the board. In fact, Amazon captures an estimated 63% of customers lost by Chewy, showing the gravitational pull of the e-commerce giant on the entire pet supply ecosystem.
Petco Health and Wellness Company, Inc. counters this intense rivalry by leaning into its integrated health and wellness strategy, which is a key differentiator from the pure e-commerce focus of Chewy.com and the more service-focused model of PetSmart. You can see the strategic intent in their service expansion and membership focus, which is designed to increase customer stickiness and lifetime value.
Here is a quick breakdown of how Petco Health and Wellness Company, Inc. is positioning its key differentiators against the competitive landscape as of late 2025:
- Differentiating services like Vetco Total Care are central to the strategy.
- Vital Care membership aims to lock in recurring service revenue.
- Gross profit margin expanded 75 basis points to 38.9% in Q3 2025, showing pricing discipline.
- The company is executing a transformation focused on profitability, with a full-year 2025 Adjusted EBITDA outlook of $395 million to $397 million.
- Petco plans for approximately ~20 net store closures in fiscal 2025.
The competitive dynamics are best summarized by looking at the financial scale of the primary online challenger. Here's how Chewy's Q2 2025 performance stacks up against Petco's Q3 2025 results, highlighting the revenue disparity:
| Metric | Chewy.com (Q2 2025) | Petco Health and Wellness Company, Inc. (Q3 2025) |
|---|---|---|
| Net Sales | $3.10 billion | $1.5 billion |
| Autoship/Comparable Sales Growth (YoY) | Autoship Sales: +15% | Comparable Sales: -2.2% |
| Active Customers | Nearly 21 million | Not explicitly stated for Q3 2025 |
| Gross Margin | 30.4% | 38.9% |
Petco Health and Wellness Company, Inc. (WOOF) - Porter's Five Forces: Threat of substitutes
You're looking at the competitive landscape for Petco Health and Wellness Company, Inc. (WOOF) as we close out 2025, and the threat from substitutes is definitely real. Substitutes aren't just direct competitors; they are alternative ways customers can get the same job done for their pets, and these alternatives are chipping away at Petco Health and Wellness Company, Inc.'s core business.
Service Substitution: Independent Providers
For services, the threat comes from decentralized, local providers. Independent groomers and local veterinary clinics offer alternatives to the services Petco Health and Wellness Company, Inc. provides in-store and through its veterinary partnerships. The sheer size of these service markets shows the scale of the substitution opportunity for consumers.
Consider the grooming market; it is expected to reach $14.5 billion by the year 2025. That's a massive pool of revenue that can be captured by a local, independent groomer who offers a more personalized experience or by a pet owner opting for a DIY approach. Similarly, veterinary care spending is projected to approach $41.5 billion in 2025. If a local, independent vet clinic builds a stronger relationship with a pet parent, that relationship often locks in both the medical service and related product recommendations, pulling them away from Petco Health and Wellness Company, Inc.'s ecosystem.
Direct-to-Consumer (DTC) Brands
The rise of digitally native, Direct-to-Consumer pet brands presents a significant channel and product substitute. While I don't have the exact 8.3% market capture figure for 2023 you mentioned, we can see the scale of the DTC threat in the food segment. We estimate the Direct-to-Customer pet food market size in 2025 at $15 billion. This segment is heavily concentrated around subscription models, offering convenience that directly competes with Petco Health and Wellness Company, Inc.'s recurring revenue streams.
To put this in perspective, established e-commerce giants are also major substitutes. Amazon alone reportedly sells $3.6 billion annually in pet food. The fact that Petco Health and Wellness Company, Inc.'s Q3 2025 net sales were $1.5 billion shows how substantial these online-only substitutes are relative to the company's current scale.
Price Sensitivity and Premium Substitution
Economic pressure forces trade-offs, and pet owners are not immune. When budgets tighten, pet owners substitute premium products with cheaper options, even if they prefer the higher-end items. This is a classic substitution pattern during economic uncertainty. For example, in 2024, 54% of American pet owners reported considering switching brands due to price increases.
This cost-consciousness is a major factor influencing household decisions. The top reason cited by pet owners for being less likely to add another pet is the cost of veterinary care and prescriptions, at 36%. When owners feel this financial strain, they look for lower-cost alternatives for food, supplies, and even services, which directly threatens the premiumization strategy Petco Health and Wellness Company, Inc. often pursues.
Behavioral Substitution: DIY Pet Care
DIY pet care acts as a behavioral substitute for professional services. Home grooming, for instance, bypasses the need to visit a professional groomer entirely. While the pet grooming industry is projected to hit $14.5 billion in 2025, a portion of that spend is diverted to at-home tools and owner time. This is especially true for routine maintenance where the perceived value of professional service is lower.
Here's the quick math: if a pet owner buys a set of clippers and watches a few online tutorials instead of paying for a full groom, that's a direct substitution of Petco Health and Wellness Company, Inc.'s service revenue for a one-time product purchase and owner labor.
Key data points illustrating the substitute landscape:
- Grooming industry expected value in 2025: $14.5 billion.
- Projected U.S. veterinary care spending in 2025: nearly $41.5 billion.
- DTC pet food market size estimated in 2025: $15 billion.
- Percentage of owners considering brand switching due to price in 2024: 54%.
- Petco Health and Wellness Company, Inc.'s FY 2025 net sales outlook: Down 2.5% to 2.8%.
You can see how these external pressures map out against Petco Health and Wellness Company, Inc.'s own performance metrics:
| Substitute Category | Relevant Market/Metric (2025 or Latest) | Value/Amount |
|---|---|---|
| Independent Grooming/DIY | Projected U.S. Pet Grooming Industry Value (2025) | $14.5 billion |
| Local Vet Clinics | Projected U.S. Veterinary Care Spending (2025) | ~$41.5 billion |
| Direct-to-Consumer Brands | Estimated DTC Pet Food Market Size (2025) | $15 billion |
| Price-Driven Substitution | Owners considering brand switching due to price (2024) | 54% |
| Petco Health and Wellness Company, Inc. Performance | FY 2025 Net Sales Outlook Change | Down 2.5% - 2.8% |
Honestly, the threat isn't one single entity; it's the fragmentation of services and products across independent operators, digital-native brands, and owner behavior shifts driven by cost. Finance: draft the sensitivity analysis on service revenue loss due to a 10% shift to independent groomers by Q2 2026 by Friday.
Petco Health and Wellness Company, Inc. (WOOF) - Porter's Five Forces: Threat of new entrants
You're looking at the barriers to entry for a new competitor trying to match Petco Health and Wellness Company, Inc.'s physical footprint, and honestly, the capital outlay is immense. Replicating Petco Health and Wellness Company, Inc.'s established physical presence alone requires staggering investment. As of the second quarter of 2025, Petco Health and Wellness Company, Inc. operated 1,388 pet care centers in the U.S. and Puerto Rico, part of a network exceeding 1,500 locations across the U.S., Mexico, and Puerto Rico reported earlier in the year.
Consider the cost to build just one modern, service-integrated location. While opening a small boutique might start around $70,000 in total startup capital, a large, premium location with extensive services-the kind Petco Health and Wellness Company, Inc. operates-can easily exceed $500,000. Now, factor in replicating their growing network of on-site veterinary hospitals, which, as of 2019, they were expanding toward 111 full-service hospitals. The cost to replicate the physical infrastructure, including lease deposits, build-out, and initial stocking for over a thousand locations, creates a formidable initial hurdle for any new entrant.
Petco Health and Wellness Company, Inc.'s brand recognition acts as a defintely strong entry barrier, though it's not impenetrable. Trust is the currency of consumer choice; you need it to make a sale. Data from early 2025 suggests that 81% of consumers need to trust a brand before they consider buying from it. Petco Health and Wellness Company, Inc. has a long history, but its current market positioning shows vulnerability. While monthly visits to petco.com hovered between 7M and 8M unique visitors in Q1 2025, fewer than 3 in 5 shoppers were repeating purchases there, compared to more than 3 in 4 at key online competitors like Chewy.com and Amazon. Furthermore, in a market tier analysis, Petco Health and Wellness Company, Inc. is classified as a Challenger, not a Leader, suggesting established competitors already hold the strongest brand recognition.
The existing scale of Petco Health and Wellness Company, Inc. helps secure cost advantages, especially in procurement and operations. With trailing twelve-month revenue around $6 billion as of Q3 2025, the company has leverage with suppliers that a startup simply won't possess. This scale allows for better inventory management, which is critical; for instance, Q3 2025 ended with inventory down 10.5% year-over-year, helping drive free cash flow to $61 million for the quarter. This operational efficiency translates into better margins, as their Q3 2025 operating margin reached 2.0%, up from 0.3% the prior year.
Still, low-cost online entrants pose a continuous, sharp threat. They bypass the massive capital requirement of physical stores. While Petco Health and Wellness Company, Inc. is focused on its in-store services-which grew 1.1% in Q2 2025-the product side faces intense digital pressure. The company's own comparable sales fell 2.2% year-over-year in Q3 2025, with softness noted in e-commerce offsetting stronger in-store performance. A new, purely digital player doesn't face the $125 million to $130 million in expected Capital Expenditures for fiscal 2025, which Petco Health and Wellness Company, Inc. must manage.
Here's a quick look at the scale difference in a table:
| Metric | Petco Health and Wellness Company, Inc. (Late 2025 Data) | New Single Store Entry Estimate (High End) |
|---|---|---|
| U.S. & PR Physical Locations | 1,388 | 1 (Target) |
| Trailing 12-Month Revenue | $6 billion | $0 (New Entrant) |
| FY 2025 Capital Expenditures Guidance | $125M - $130M | $0 (Initial CapEx only) |
| Estimated Single Store Startup Cost (Large Format) | N/A (Scale Advantage) | Over $500,000 |
The threat manifests through digital channels where the cost to acquire a customer is often lower than maintaining a physical store network. New entrants can focus capital on digital marketing, where competitors like Chewy spent over $32M in monthly ad spend in March 2025, targeting high-reach channels like Facebook and OTT.
- Consumers repeating at Petco Health and Wellness Company, Inc. are fewer than 3 in 5.
- Gen Z pet owners spend 55% more at Petco Health and Wellness Company, Inc. than the average pet owner.
- The company's full-year 2025 Net Sales outlook projects a decline of 2.5% to 2.8%.
Finance: draft a sensitivity analysis on the impact of a new, digitally-native competitor achieving a 3 in 4 repeat purchase rate by Q4 2026.
Disclaimer
All information, articles, and product details provided on this website are for general informational and educational purposes only. We do not claim any ownership over, nor do we intend to infringe upon, any trademarks, copyrights, logos, brand names, or other intellectual property mentioned or depicted on this site. Such intellectual property remains the property of its respective owners, and any references here are made solely for identification or informational purposes, without implying any affiliation, endorsement, or partnership.
We make no representations or warranties, express or implied, regarding the accuracy, completeness, or suitability of any content or products presented. Nothing on this website should be construed as legal, tax, investment, financial, medical, or other professional advice. In addition, no part of this site—including articles or product references—constitutes a solicitation, recommendation, endorsement, advertisement, or offer to buy or sell any securities, franchises, or other financial instruments, particularly in jurisdictions where such activity would be unlawful.
All content is of a general nature and may not address the specific circumstances of any individual or entity. It is not a substitute for professional advice or services. Any actions you take based on the information provided here are strictly at your own risk. You accept full responsibility for any decisions or outcomes arising from your use of this website and agree to release us from any liability in connection with your use of, or reliance upon, the content or products found herein.