
|
ليفي شتراوس & Co. (Levi) DCF تقييم |
Fully Editable: Tailor To Your Needs In Excel Or Sheets
Professional Design: Trusted, Industry-Standard Templates
Investor-Approved Valuation Models
MAC/PC Compatible, Fully Unlocked
No Expertise Is Needed; Easy To Follow
Levi Strauss & Co. (LEVI) Bundle
تبسيط ليفي شتراوس & Co. (Levi) تقييم مع هذه الآلة الحاسبة DCF القابلة للتخصيص! يضم ليفي شتراوس الحقيقي & Co. (Levi) البيانات المالية والمدخلات المتوقعة القابلة للتعديل ، يمكنك اختبار السيناريوهات وكشف Levi Strauss & Co. (Levi) القيمة العادلة في دقائق.
What You Will Get
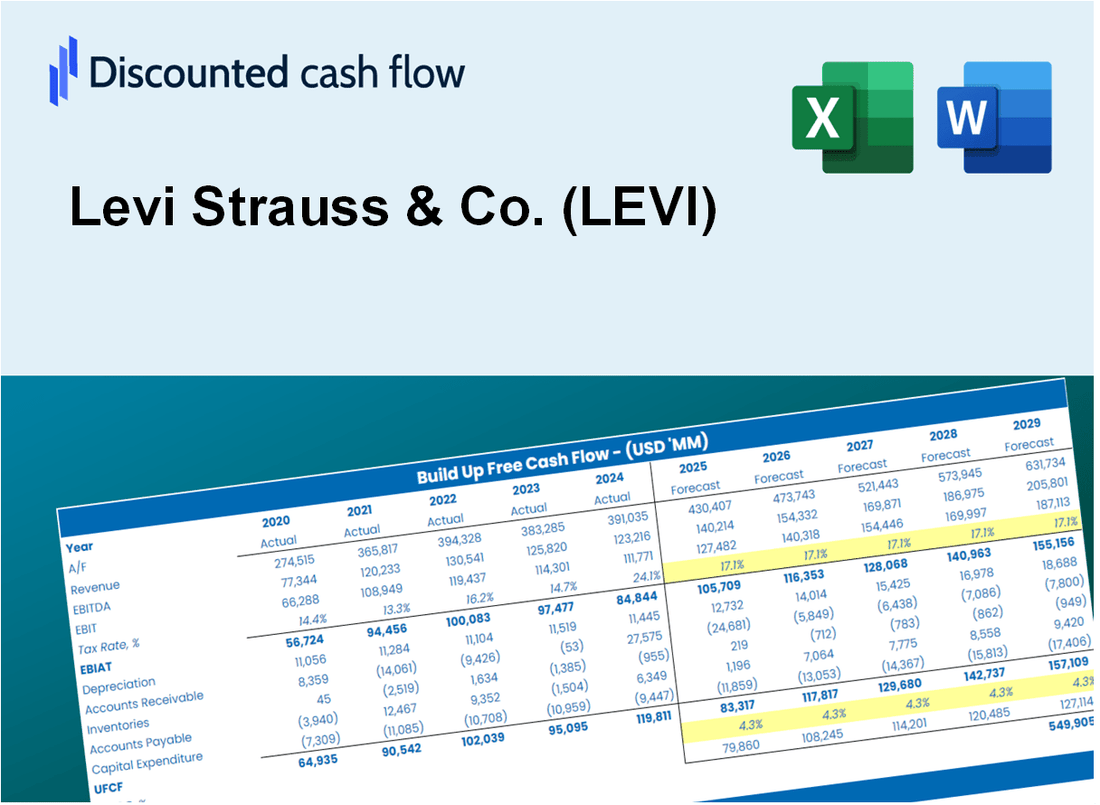
- Real LEVI Financials: Access to historical and projected data for precise valuation.
- Customizable Inputs: Adjust WACC, tax rates, revenue growth, and capital expenditures as needed.
- Dynamic Calculations: Intrinsic value and NPV are computed in real-time.
- Scenario Analysis: Explore various scenarios to assess Levi Strauss & Co.'s future performance.
- User-Friendly Interface: Designed for professionals but easy for newcomers to navigate.
Key Features
- Comprehensive Historical Data: Access Levi Strauss & Co.'s (LEVI) past financial statements and pre-filled projections.
- Customizable Assumptions: Modify WACC, tax rates, revenue growth, and EBITDA margins as needed.
- Real-Time Insights: Observe the recalculation of Levi's intrinsic value instantly.
- Intuitive Visualizations: Dashboard graphs present valuation outcomes and essential metrics clearly.
- Designed for Precision: A reliable tool tailored for analysts, investors, and finance professionals.
How It Works
- Step 1: Download the prebuilt Excel template with Levi Strauss & Co.'s (LEVI) data included.
- Step 2: Explore the pre-filled sheets and familiarize yourself with the key performance indicators.
- Step 3: Update forecasts and assumptions in the editable yellow cells (WACC, growth, margins).
- Step 4: Instantly view recalculated results, including Levi Strauss & Co.'s (LEVI) intrinsic value.
- Step 5: Make informed investment decisions or generate reports using the outputs.
Why Choose This Calculator for Levi Strauss & Co. (LEVI)?
- Designed for Industry Experts: A sophisticated tool tailored for analysts, CFOs, and financial consultants.
- Accurate Financial Data: Levi Strauss & Co.’s historical and projected financials are preloaded for precision.
- Flexible Scenario Analysis: Effortlessly simulate various forecasts and assumptions.
- Comprehensive Outputs: Automatically calculates intrinsic value, NPV, and essential metrics.
- User-Friendly Interface: Step-by-step guidance makes the process straightforward.
Who Should Use This Product?
- Fashion Students: Explore industry trends and apply them using real market data.
- Researchers: Integrate established models into academic projects or studies.
- Investors: Evaluate your own strategies and analyze valuation outcomes for Levi Strauss & Co. (LEVI).
- Market Analysts: Enhance your analysis with a ready-to-use, customizable financial model.
- Entrepreneurs: Understand how major apparel brands like Levi Strauss & Co. (LEVI) are assessed in the market.
What the Template Contains
- Pre-Filled DCF Model: Levi Strauss & Co.’s financial data preloaded for immediate use.
- WACC Calculator: Detailed calculations for Weighted Average Cost of Capital.
- Financial Ratios: Evaluate Levi Strauss & Co.’s profitability, leverage, and efficiency.
- Editable Inputs: Change assumptions such as growth, margins, and CAPEX to fit your scenarios.
- Financial Statements: Annual and quarterly reports to support detailed analysis.
- Interactive Dashboard: Easily visualize key valuation metrics and results.
Disclaimer
All information, articles, and product details provided on this website are for general informational and educational purposes only. We do not claim any ownership over, nor do we intend to infringe upon, any trademarks, copyrights, logos, brand names, or other intellectual property mentioned or depicted on this site. Such intellectual property remains the property of its respective owners, and any references here are made solely for identification or informational purposes, without implying any affiliation, endorsement, or partnership.
We make no representations or warranties, express or implied, regarding the accuracy, completeness, or suitability of any content or products presented. Nothing on this website should be construed as legal, tax, investment, financial, medical, or other professional advice. In addition, no part of this site—including articles or product references—constitutes a solicitation, recommendation, endorsement, advertisement, or offer to buy or sell any securities, franchises, or other financial instruments, particularly in jurisdictions where such activity would be unlawful.
All content is of a general nature and may not address the specific circumstances of any individual or entity. It is not a substitute for professional advice or services. Any actions you take based on the information provided here are strictly at your own risk. You accept full responsibility for any decisions or outcomes arising from your use of this website and agree to release us from any liability in connection with your use of, or reliance upon, the content or products found herein.