
|
NASDAQ ، Inc. (NDAQ) DCF تقييم |
Fully Editable: Tailor To Your Needs In Excel Or Sheets
Professional Design: Trusted, Industry-Standard Templates
Investor-Approved Valuation Models
MAC/PC Compatible, Fully Unlocked
No Expertise Is Needed; Easy To Follow
Nasdaq, Inc. (NDAQ) Bundle
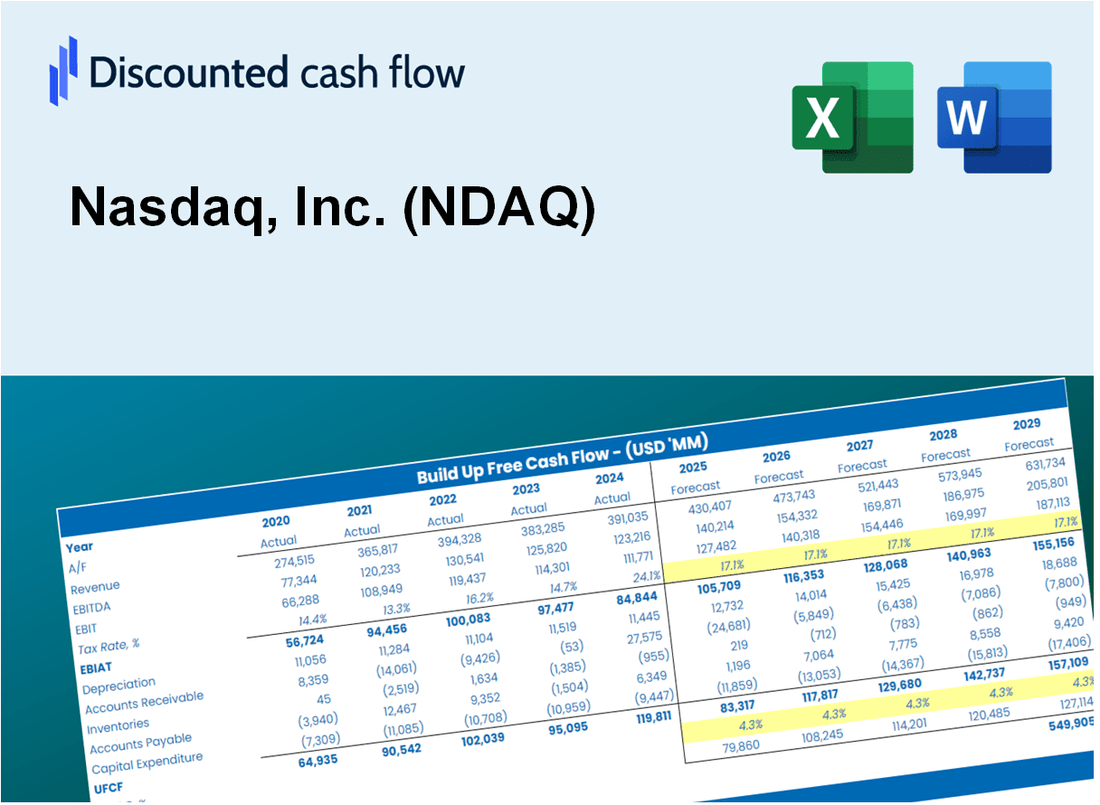
تقييم التوقعات المالية NASDAQ ، Inc. (NDAQ) مثل المحترف! توفر حاسبة DCF (NDAQ) هذه (NDAQ) بيانات مالية مملوءة مسبقًا ومرونة كاملة لتعديل نمو الإيرادات ، WACC ، الهوامش ، وغيرها من الافتراضات الأساسية التي تتماشى مع توقعاتك.
Discounted Cash Flow (DCF) - (USD MM)
| Year | AY1 2020 |
AY2 2021 |
AY3 2022 |
AY4 2023 |
AY5 2024 |
FY1 2025 |
FY2 2026 |
FY3 2027 |
FY4 2028 |
FY5 2029 |
|---|---|---|---|---|---|---|---|---|---|---|
| Revenue | 5,625.0 | 5,886.0 | 6,226.0 | 6,064.0 | 7,400.0 | 7,952.2 | 8,545.5 | 9,183.1 | 9,868.3 | 10,604.7 |
| Revenue Growth, % | 0 | 4.64 | 5.78 | -2.6 | 22.03 | 7.46 | 7.46 | 7.46 | 7.46 | 7.46 |
| EBITDA | 1,507.0 | 1,927.0 | 1,853.0 | 1,996.0 | 2,460.0 | 2,472.3 | 2,656.8 | 2,855.1 | 3,068.1 | 3,297.0 |
| EBITDA, % | 26.79 | 32.74 | 29.76 | 32.92 | 33.24 | 31.09 | 31.09 | 31.09 | 31.09 | 31.09 |
| Depreciation | 202.0 | 278.0 | 258.0 | 323.0 | 613.0 | 414.6 | 445.5 | 478.8 | 514.5 | 552.9 |
| Depreciation, % | 3.59 | 4.72 | 4.14 | 5.33 | 8.28 | 5.21 | 5.21 | 5.21 | 5.21 | 5.21 |
| EBIT | 1,305.0 | 1,649.0 | 1,595.0 | 1,673.0 | 1,847.0 | 2,057.7 | 2,211.3 | 2,376.3 | 2,553.6 | 2,744.1 |
| EBIT, % | 23.2 | 28.02 | 25.62 | 27.59 | 24.96 | 25.88 | 25.88 | 25.88 | 25.88 | 25.88 |
| Total Cash | 2,940.0 | 601.0 | 683.0 | 641.0 | 776.0 | 1,503.0 | 1,615.2 | 1,735.7 | 1,865.2 | 2,004.4 |
| Total Cash, percent | .0 | .0 | .0 | .0 | .0 | .0 | .0 | .0 | .0 | .0 |
| Account Receivables | 566.0 | 588.0 | 677.0 | 929.0 | 1,022.0 | 955.2 | 1,026.4 | 1,103.0 | 1,185.3 | 1,273.8 |
| Account Receivables, % | 10.06 | 9.99 | 10.87 | 15.32 | 13.81 | 12.01 | 12.01 | 12.01 | 12.01 | 12.01 |
| Inventories | .0 | .0 | .0 | .0 | .0 | .0 | .0 | .0 | .0 | .0 |
| Inventories, % | 0 | 0 | 0 | 0 | 0 | 0 | 0 | 0 | 0 | 0 |
| Accounts Payable | 175.0 | 185.0 | 185.0 | 332.0 | 269.0 | 291.6 | 313.4 | 336.8 | 361.9 | 388.9 |
| Accounts Payable, % | 3.11 | 3.14 | 2.97 | 5.47 | 3.64 | 3.67 | 3.67 | 3.67 | 3.67 | 3.67 |
| Capital Expenditure | -188.0 | -163.0 | -152.0 | -158.0 | -207.0 | -222.0 | -238.5 | -256.3 | -275.4 | -296.0 |
| Capital Expenditure, % | -3.34 | -2.77 | -2.44 | -2.61 | -2.8 | -2.79 | -2.79 | -2.79 | -2.79 | -2.79 |
| Tax Rate, % | 22.91 | 22.91 | 22.91 | 22.91 | 22.91 | 22.91 | 22.91 | 22.91 | 22.91 | 22.91 |
| EBITAT | 1,004.6 | 1,276.0 | 1,216.5 | 1,264.6 | 1,423.8 | 1,577.5 | 1,695.2 | 1,821.7 | 1,957.6 | 2,103.7 |
| Depreciation | ||||||||||
| Changes in Account Receivables | ||||||||||
| Changes in Inventories | ||||||||||
| Changes in Accounts Payable | ||||||||||
| Capital Expenditure | ||||||||||
| UFCF | 627.6 | 1,379.0 | 1,233.5 | 1,324.6 | 1,673.8 | 1,859.6 | 1,852.7 | 1,990.9 | 2,139.5 | 2,299.1 |
| WACC, % | 7.67 | 7.67 | 7.66 | 7.66 | 7.67 | 7.66 | 7.66 | 7.66 | 7.66 | 7.66 |
| PV UFCF | ||||||||||
| SUM PV UFCF | 8,102.7 | |||||||||
| Long Term Growth Rate, % | 2.00 | |||||||||
| Free cash flow (T + 1) | 2,345 | |||||||||
| Terminal Value | 41,410 | |||||||||
| Present Terminal Value | 28,626 | |||||||||
| Enterprise Value | 36,729 | |||||||||
| Net Debt | 9,276 | |||||||||
| Equity Value | 27,453 | |||||||||
| Diluted Shares Outstanding, MM | 579 | |||||||||
| Equity Value Per Share | 47.40 |
What You Will Get
- Editable Forecast Inputs: Easily modify key assumptions (growth %, margins, WACC) to generate various scenarios.
- Real-World Data: Nasdaq, Inc. (NDAQ) financial data pre-filled to kickstart your analysis.
- Automatic DCF Outputs: The template computes Net Present Value (NPV) and intrinsic value automatically.
- Customizable and Professional: A sleek Excel model that adjusts to your valuation requirements.
- Built for Analysts and Investors: Perfect for evaluating projections, confirming strategies, and enhancing efficiency.
Key Features
- Real-Life NDAQ Data: Pre-filled with Nasdaq’s historical financials and future projections.
- Fully Customizable Inputs: Modify revenue growth, profit margins, WACC, tax rates, and capital expenditures as needed.
- Dynamic Valuation Model: Automatic recalculations of Net Present Value (NPV) and intrinsic value based on your adjustments.
- Scenario Testing: Develop multiple forecasting scenarios to explore various valuation possibilities.
- User-Friendly Design: Intuitive, organized, and crafted for both professionals and newcomers.
How It Works
- Download: Obtain the pre-configured Excel file featuring Nasdaq, Inc.'s (NDAQ) financial data.
- Customize: Modify projections, including revenue growth, EBITDA %, and WACC.
- Update Automatically: The intrinsic value and NPV calculations refresh in real-time.
- Test Scenarios: Develop various projections and instantly compare the results.
- Make Decisions: Utilize the valuation findings to inform your investment strategy.
Why Choose This Calculator?
- Accuracy: Real Nasdaq financials ensure data accuracy.
- Flexibility: Designed for users to test and modify inputs freely.
- Time-Saving: Skip the hassle of building a DCF model from scratch.
- Professional-Grade: Developed with CFO-level precision and usability in mind.
- User-Friendly: Easy to use, even for those without advanced financial modeling experience.
Who Should Use Nasdaq, Inc. (NDAQ)?
- Investors: Gain insights into market trends and make informed trading decisions with Nasdaq's advanced analytics.
- Financial Analysts: Utilize comprehensive data and tools for accurate market analysis and reporting.
- Traders: Benefit from real-time data and execution capabilities to enhance trading strategies.
- Market Researchers: Access extensive historical data for in-depth market studies and research projects.
- Educators and Students: Leverage Nasdaq's resources for an enriched learning experience in finance and trading courses.
What the Template Contains
- Pre-Filled DCF Model: Nasdaq, Inc.’s (NDAQ) financial data preloaded for immediate use.
- WACC Calculator: Detailed calculations for Weighted Average Cost of Capital.
- Financial Ratios: Evaluate Nasdaq’s (NDAQ) profitability, leverage, and efficiency.
- Editable Inputs: Change assumptions such as growth, margins, and CAPEX to fit your scenarios.
- Financial Statements: Annual and quarterly reports to support detailed analysis.
- Interactive Dashboard: Easily visualize key valuation metrics and results.
Disclaimer
All information, articles, and product details provided on this website are for general informational and educational purposes only. We do not claim any ownership over, nor do we intend to infringe upon, any trademarks, copyrights, logos, brand names, or other intellectual property mentioned or depicted on this site. Such intellectual property remains the property of its respective owners, and any references here are made solely for identification or informational purposes, without implying any affiliation, endorsement, or partnership.
We make no representations or warranties, express or implied, regarding the accuracy, completeness, or suitability of any content or products presented. Nothing on this website should be construed as legal, tax, investment, financial, medical, or other professional advice. In addition, no part of this site—including articles or product references—constitutes a solicitation, recommendation, endorsement, advertisement, or offer to buy or sell any securities, franchises, or other financial instruments, particularly in jurisdictions where such activity would be unlawful.
All content is of a general nature and may not address the specific circumstances of any individual or entity. It is not a substitute for professional advice or services. Any actions you take based on the information provided here are strictly at your own risk. You accept full responsibility for any decisions or outcomes arising from your use of this website and agree to release us from any liability in connection with your use of, or reliance upon, the content or products found herein.