
|
Evergy, Inc. (EVRG) DCF -Bewertung |
Fully Editable: Tailor To Your Needs In Excel Or Sheets
Professional Design: Trusted, Industry-Standard Templates
Investor-Approved Valuation Models
MAC/PC Compatible, Fully Unlocked
No Expertise Is Needed; Easy To Follow
Evergy, Inc. (EVRG) Bundle
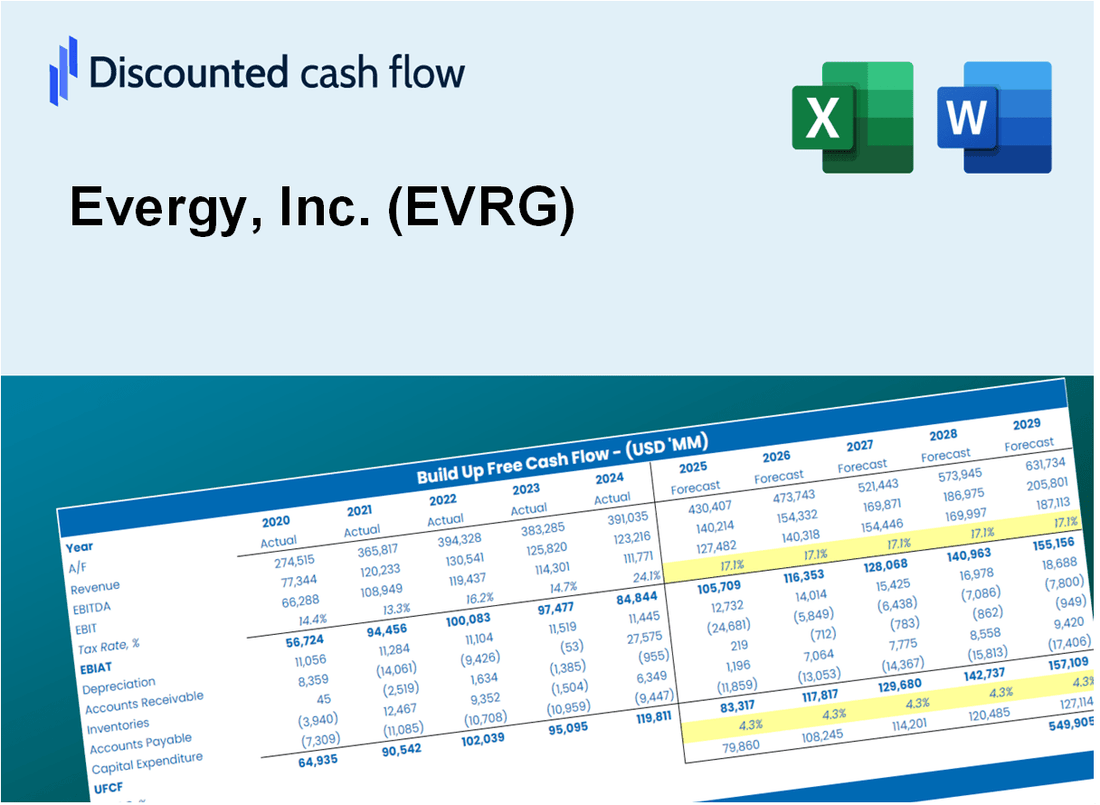
Wenn Sie ein Investor oder Analyst sind, ist dieser [EVRG] DCF-Taschenrechner Ihre Anlaufstelle für eine genaue Bewertung. Mit echten Daten von Evergy, Inc. geladen, können Sie Prognosen anpassen und die Auswirkungen sofort beobachten.
What You Will Get
- Real Evergy Data: Preloaded financials – from revenue to EBIT – based on actual and projected figures.
- Full Customization: Adjust all critical parameters (yellow cells) like WACC, growth %, and tax rates.
- Instant Valuation Updates: Automatic recalculations to analyze the impact of changes on Evergy’s fair value.
- Versatile Excel Template: Tailored for quick edits, scenario testing, and detailed projections.
- Time-Saving and Accurate: Skip building models from scratch while maintaining precision and flexibility.
Key Features
- Comprehensive EVRG Data: Pre-loaded with Evergy’s historical financial performance and future projections.
- Customizable Financial Inputs: Modify growth rates, operating margins, discount rates, tax assumptions, and capital expenditures.
- Interactive Valuation Framework: Real-time updates to Net Present Value (NPV) and intrinsic value based on your adjustments.
- Scenario Analysis: Develop various forecasting scenarios to evaluate different valuation possibilities.
- Intuitive User Interface: Well-organized and designed for both seasoned professionals and newcomers.
How It Works
- Step 1: Download the Excel file.
- Step 2: Review pre-entered Evergy, Inc. (EVRG) data (historical and projected).
- Step 3: Adjust key assumptions (yellow cells) based on your analysis.
- Step 4: View automatic recalculations for Evergy, Inc. (EVRG)'s intrinsic value.
- Step 5: Use the outputs for investment decisions or reporting.
Why Choose This Calculator for Evergy, Inc. (EVRG)?
- User-Friendly Interface: Perfect for both novices and seasoned professionals.
- Customizable Inputs: Adjust parameters effortlessly to suit your financial analysis.
- Real-Time Adjustments: Monitor immediate changes to Evergy’s valuation as you modify inputs.
- Preloaded Data: Comes with Evergy’s actual financial metrics for swift evaluations.
- Relied Upon by Experts: Favored by investors and financial analysts for making strategic decisions.
Who Should Use Evergy, Inc. (EVRG)?
- Investors: Gain insights for informed decisions with a reliable energy sector analysis tool.
- Financial Analysts: Streamline your workflow with a customizable financial model tailored for utilities.
- Consultants: Effortlessly modify the framework for client reports or energy market presentations.
- Energy Enthusiasts: Enhance your knowledge of the energy sector using practical case studies.
- Educators and Students: Utilize it as a hands-on resource in energy finance courses.
What the Evergy, Inc. (EVRG) Template Contains
- Comprehensive DCF Model: Editable template featuring detailed valuation calculations.
- Real-World Data: Evergy’s historical and projected financials preloaded for in-depth analysis.
- Customizable Parameters: Modify WACC, growth rates, and tax assumptions to explore various scenarios.
- Financial Statements: Complete annual and quarterly breakdowns for enhanced insights.
- Key Ratios: Integrated analysis for profitability, efficiency, and leverage metrics.
- Dashboard with Visual Outputs: Graphs and tables providing clear, actionable results.
Disclaimer
All information, articles, and product details provided on this website are for general informational and educational purposes only. We do not claim any ownership over, nor do we intend to infringe upon, any trademarks, copyrights, logos, brand names, or other intellectual property mentioned or depicted on this site. Such intellectual property remains the property of its respective owners, and any references here are made solely for identification or informational purposes, without implying any affiliation, endorsement, or partnership.
We make no representations or warranties, express or implied, regarding the accuracy, completeness, or suitability of any content or products presented. Nothing on this website should be construed as legal, tax, investment, financial, medical, or other professional advice. In addition, no part of this site—including articles or product references—constitutes a solicitation, recommendation, endorsement, advertisement, or offer to buy or sell any securities, franchises, or other financial instruments, particularly in jurisdictions where such activity would be unlawful.
All content is of a general nature and may not address the specific circumstances of any individual or entity. It is not a substitute for professional advice or services. Any actions you take based on the information provided here are strictly at your own risk. You accept full responsibility for any decisions or outcomes arising from your use of this website and agree to release us from any liability in connection with your use of, or reliance upon, the content or products found herein.