
|
Kimco Realty Corporation (KIM) DCF -Bewertung |
Fully Editable: Tailor To Your Needs In Excel Or Sheets
Professional Design: Trusted, Industry-Standard Templates
Investor-Approved Valuation Models
MAC/PC Compatible, Fully Unlocked
No Expertise Is Needed; Easy To Follow
Kimco Realty Corporation (KIM) Bundle
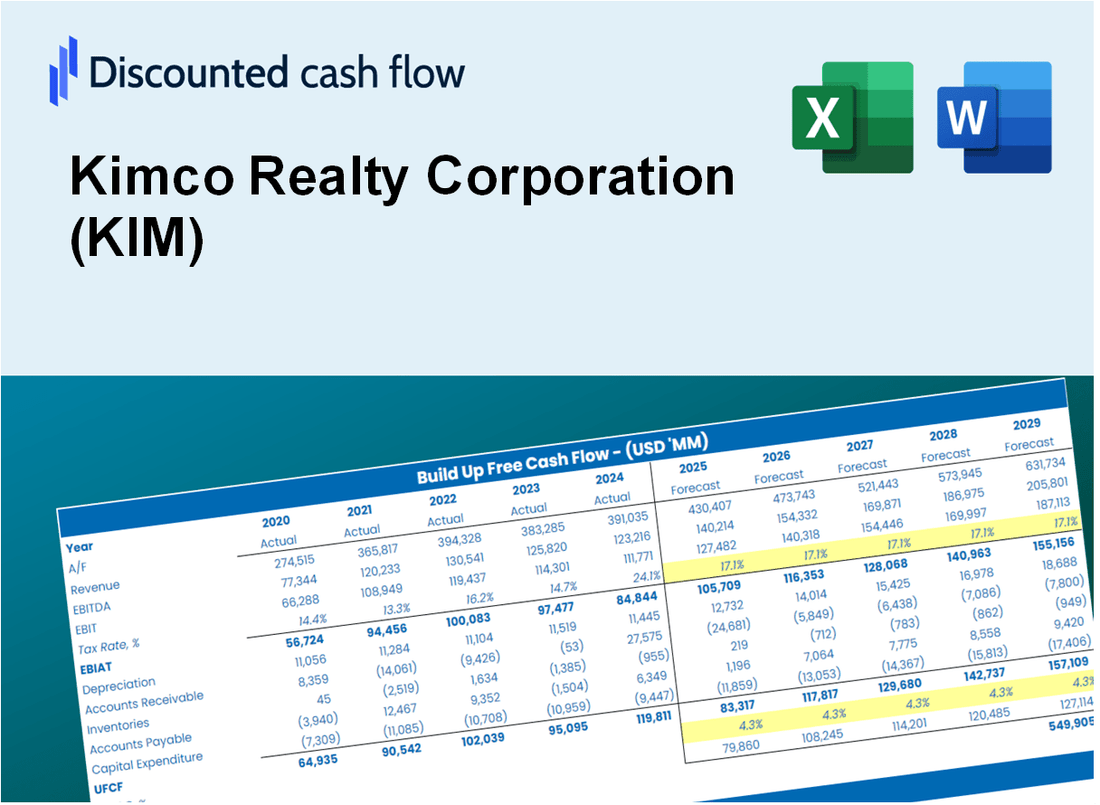
Streamline Kimco Realty Corporation (KIM) Bewertung mit diesem vielseitigen DCF -Taschenrechner! Ausgestattet mit den tatsächlichen Finanzmitteln der Kimco Realty Corporation (KIM) und flexiblen Prognose, können Sie verschiedene Szenarien untersuchen und in nur wenigen Minuten den Fair -Wert der Kimco Realty Corporation (KIM) ermitteln.
What You Will Receive
- Pre-Filled Financial Model: Kimco Realty Corporation’s actual data facilitates accurate DCF valuation.
- Comprehensive Forecast Control: Modify revenue growth, margins, WACC, and other essential drivers.
- Real-Time Calculations: Automatic updates allow you to view results instantly as you adjust parameters.
- Professional-Grade Template: A polished Excel file crafted for high-quality valuation.
- Flexible and Reusable: Designed for adaptability, enabling repetitive use for in-depth forecasts.
Key Features
- Comprehensive Market Data: Access reliable pre-loaded historical figures and future forecasts for Kimco Realty Corporation (KIM).
- Adjustable Valuation Parameters: Modify highlighted fields such as WACC, growth rates, and profit margins.
- Real-Time Calculations: Instant updates to DCF, Net Present Value (NPV), and cash flow evaluations.
- Interactive Visualization: User-friendly charts and summaries to help you interpret your valuation outcomes.
- Suitable for All Skill Levels: An intuitive layout designed for investors, CFOs, and consultants alike.
How It Works
- Step 1: Download the Excel file.
- Step 2: Review pre-entered Kimco Realty Corporation (KIM) data (historical and projected).
- Step 3: Adjust key assumptions (yellow cells) based on your analysis.
- Step 4: View automatic recalculations for Kimco Realty Corporation’s intrinsic value.
- Step 5: Use the outputs for investment decisions or reporting.
Why Choose Kimco Realty Corporation (KIM)?
- Expertise in Retail Real Estate: Over 60 years of experience in the retail property sector.
- Strong Portfolio: A diverse range of high-quality properties across prime locations.
- Commitment to Sustainability: Initiatives aimed at reducing environmental impact and enhancing community engagement.
- Proven Track Record: Consistent performance and reliable returns for investors.
- Dedicated Management Team: A professional team focused on maximizing asset value and tenant satisfaction.
Who Should Use Kimco Realty Corporation (KIM)?
- Real Estate Investors: Make informed investment choices with a comprehensive analysis of property values.
- Market Analysts: Streamline your research with detailed market reports tailored for the real estate sector.
- Property Consultants: Easily customize presentations and reports for your clients using our robust data.
- Real Estate Enthusiasts: Enhance your knowledge of market trends and valuation methods with practical insights.
- Students and Educators: Utilize our resources as a hands-on learning tool in real estate and finance courses.
What the Template Contains
- Pre-Filled Data: Includes Kimco Realty Corporation’s historical financials and forecasts.
- Discounted Cash Flow Model: Editable DCF valuation model with automatic calculations.
- Weighted Average Cost of Capital (WACC): A dedicated sheet for calculating WACC based on custom inputs.
- Key Financial Ratios: Analyze Kimco Realty Corporation’s profitability, efficiency, and leverage.
- Customizable Inputs: Edit revenue growth, margins, and tax rates with ease.
- Clear Dashboard: Charts and tables summarizing key valuation results.
Disclaimer
All information, articles, and product details provided on this website are for general informational and educational purposes only. We do not claim any ownership over, nor do we intend to infringe upon, any trademarks, copyrights, logos, brand names, or other intellectual property mentioned or depicted on this site. Such intellectual property remains the property of its respective owners, and any references here are made solely for identification or informational purposes, without implying any affiliation, endorsement, or partnership.
We make no representations or warranties, express or implied, regarding the accuracy, completeness, or suitability of any content or products presented. Nothing on this website should be construed as legal, tax, investment, financial, medical, or other professional advice. In addition, no part of this site—including articles or product references—constitutes a solicitation, recommendation, endorsement, advertisement, or offer to buy or sell any securities, franchises, or other financial instruments, particularly in jurisdictions where such activity would be unlawful.
All content is of a general nature and may not address the specific circumstances of any individual or entity. It is not a substitute for professional advice or services. Any actions you take based on the information provided here are strictly at your own risk. You accept full responsibility for any decisions or outcomes arising from your use of this website and agree to release us from any liability in connection with your use of, or reliance upon, the content or products found herein.