
|
Territorial Bancorp Inc. (TBNK) DCF -Bewertung |
Fully Editable: Tailor To Your Needs In Excel Or Sheets
Professional Design: Trusted, Industry-Standard Templates
Investor-Approved Valuation Models
MAC/PC Compatible, Fully Unlocked
No Expertise Is Needed; Easy To Follow
Territorial Bancorp Inc. (TBNK) Bundle
Vereinfachen Sie die Bewertung der territorialen Bancorp Inc. (TBNK) mit diesem anpassbaren DCF -Taschenrechner! Mit Real Territorial Bancorp Inc. (TBNK) Finanzdaten und einstellbaren Prognoseeingaben können Sie Szenarien testen und territoriale Bancorp Inc. (TBNK) in Minuten aufdecken.
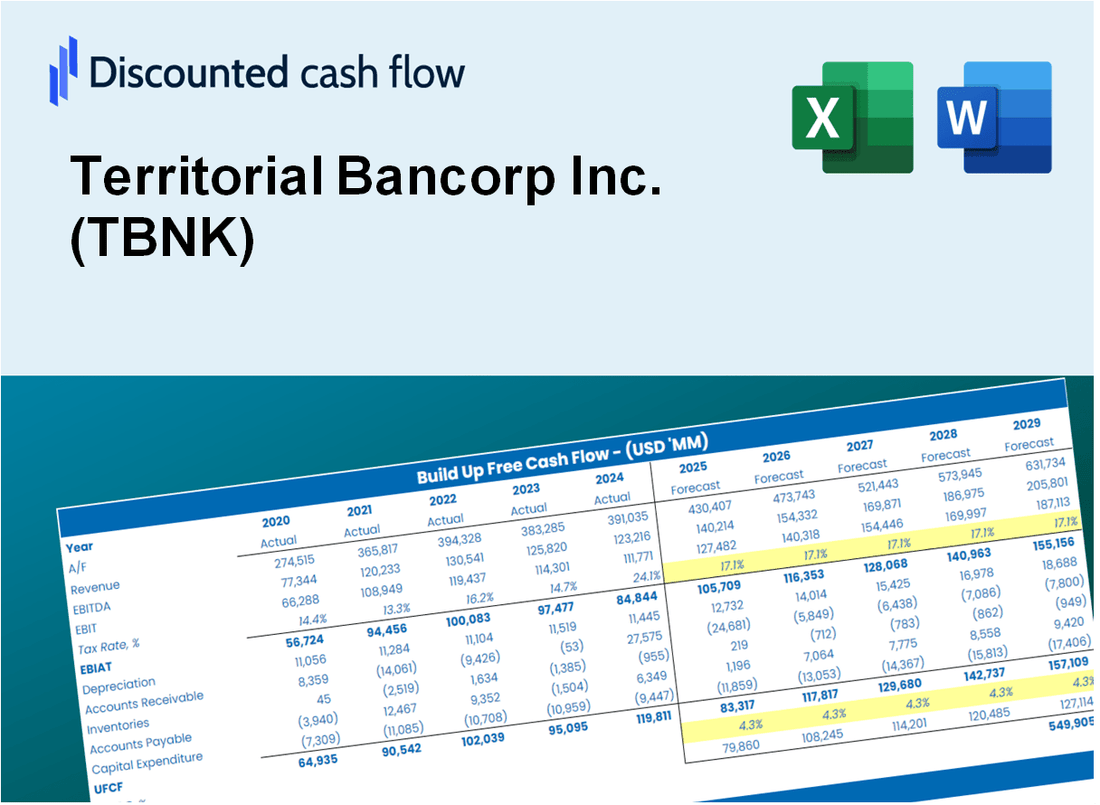
Discounted Cash Flow (DCF) - (USD MM)
| Year | AY1 2020 |
AY2 2021 |
AY3 2022 |
AY4 2023 |
AY5 2024 |
FY1 2025 |
FY2 2026 |
FY3 2027 |
FY4 2028 |
FY5 2029 |
|---|---|---|---|---|---|---|---|---|---|---|
| Revenue | 64.4 | 60.5 | 59.7 | 45.1 | 36.4 | 31.8 | 27.7 | 24.2 | 21.1 | 18.4 |
| Revenue Growth, % | 0 | -6.02 | -1.32 | -24.45 | -19.29 | -12.77 | -12.77 | -12.77 | -12.77 | -12.77 |
| EBITDA | 29.8 | 28.0 | 25.6 | 10.8 | .0 | 10.1 | 8.8 | 7.7 | 6.7 | 5.9 |
| EBITDA, % | 46.35 | 46.32 | 42.89 | 23.83 | 0 | 31.88 | 31.88 | 31.88 | 31.88 | 31.88 |
| Depreciation | 4.5 | 4.2 | 4.1 | 3.9 | .0 | 1.9 | 1.6 | 1.4 | 1.2 | 1.1 |
| Depreciation, % | 7.01 | 6.98 | 6.91 | 8.68 | 0 | 5.92 | 5.92 | 5.92 | 5.92 | 5.92 |
| EBIT | 25.3 | 23.8 | 21.5 | 6.8 | .0 | 8.2 | 7.2 | 6.3 | 5.5 | 4.8 |
| EBIT, % | 39.34 | 39.35 | 35.97 | 15.16 | 0 | 25.96 | 25.96 | 25.96 | 25.96 | 25.96 |
| Total Cash | 367.1 | 99.9 | 61.4 | 126.7 | 123.5 | 31.8 | 27.7 | 24.2 | 21.1 | 18.4 |
| Total Cash, percent | .0 | .0 | .0 | .0 | .0 | .0 | .0 | .0 | .0 | .0 |
| Account Receivables | 6.5 | 5.8 | 1,300.9 | 6.4 | .0 | 8.5 | 7.4 | 6.5 | 5.6 | 4.9 |
| Account Receivables, % | 10.12 | 9.56 | 2179.17 | 14.3 | 0 | 26.8 | 26.8 | 26.8 | 26.8 | 26.8 |
| Inventories | -20.9 | -17.4 | .6 | .0 | .0 | -3.8 | -3.3 | -2.9 | -2.5 | -2.2 |
| Inventories, % | -32.42 | -28.84 | 1.03 | 0 | 0 | -12.05 | -12.05 | -12.05 | -12.05 | -12.05 |
| Accounts Payable | 29.2 | 22.6 | 24.2 | 23.3 | .0 | 11.1 | 9.7 | 8.5 | 7.4 | 6.4 |
| Accounts Payable, % | 45.4 | 37.42 | 40.51 | 51.74 | 0 | 35.01 | 35.01 | 35.01 | 35.01 | 35.01 |
| Capital Expenditure | -1.8 | -.4 | -4.7 | -.7 | .0 | -.8 | -.7 | -.6 | -.5 | -.5 |
| Capital Expenditure, % | -2.74 | -0.60003 | -7.9 | -1.52 | 0 | -2.55 | -2.55 | -2.55 | -2.55 | -2.55 |
| Tax Rate, % | 35.97 | 35.97 | 35.97 | 35.97 | 35.97 | 35.97 | 35.97 | 35.97 | 35.97 | 35.97 |
| EBITAT | 18.6 | 17.4 | 16.2 | 5.0 | .0 | 5.9 | 5.2 | 4.5 | 3.9 | 3.4 |
| Depreciation | ||||||||||
| Changes in Account Receivables | ||||||||||
| Changes in Inventories | ||||||||||
| Changes in Accounts Payable | ||||||||||
| Capital Expenditure | ||||||||||
| UFCF | 64.9 | 12.0 | -1,296.0 | 1,302.5 | -16.9 | 13.4 | 5.3 | 4.6 | 4.0 | 3.5 |
| WACC, % | 4.12 | 4.11 | 4.17 | 4.12 | 3.86 | 4.08 | 4.08 | 4.08 | 4.08 | 4.08 |
| PV UFCF | ||||||||||
| SUM PV UFCF | 28.2 | |||||||||
| Long Term Growth Rate, % | 2.00 | |||||||||
| Free cash flow (T + 1) | 4 | |||||||||
| Terminal Value | 172 | |||||||||
| Present Terminal Value | 141 | |||||||||
| Enterprise Value | 169 | |||||||||
| Net Debt | 36 | |||||||||
| Equity Value | 133 | |||||||||
| Diluted Shares Outstanding, MM | 9 | |||||||||
| Equity Value Per Share | 15.42 |
What You Will Get
- Editable Excel Template: A fully customizable Excel-based DCF Calculator featuring pre-filled real TBNK financials.
- Real-World Data: Historical data and forward-looking estimates (as indicated in the yellow cells).
- Forecast Flexibility: Adjust forecast assumptions such as revenue growth, EBITDA %, and WACC.
- Automatic Calculations: Quickly observe the effects of your inputs on Territorial Bancorp Inc.'s valuation.
- Professional Tool: Designed for investors, CFOs, consultants, and financial analysts.
- User-Friendly Design: Organized for clarity and ease of use, complete with step-by-step instructions.
Key Features
- Customizable Financial Inputs: Adjust essential parameters such as loan growth, net interest margin, and operating expenses.
- Instant DCF Valuation: Provides real-time calculations of intrinsic value, NPV, and additional financial metrics.
- High-Precision Accuracy: Leverages Territorial Bancorp Inc.'s (TBNK) actual financial data for dependable valuation results.
- Streamlined Scenario Analysis: Easily evaluate various assumptions and analyze the resulting impacts.
- Efficiency Booster: Remove the hassle of constructing intricate valuation models from the ground up.
How It Works
- Download the Template: Gain immediate access to the Excel-based TBNK DCF Calculator.
- Input Your Assumptions: Modify the yellow-highlighted cells for growth rates, WACC, margins, and other variables.
- Instant Calculations: The model automatically recalculates Territorial Bancorp Inc.’s intrinsic value.
- Test Scenarios: Experiment with various assumptions to see how they impact potential valuations.
- Analyze and Decide: Utilize the results to inform your investment or financial decisions.
Why Choose Territorial Bancorp Inc. (TBNK)?
- Save Time: Quickly access financial insights without the hassle of complex models.
- Enhance Accuracy: Dependable data and calculations minimize valuation errors.
- Fully Customizable: Adjust parameters to align with your specific financial outlook.
- Easy to Understand: Intuitive visuals and outputs facilitate straightforward analysis.
- Preferred by Professionals: Created for experts who prioritize accuracy and ease of use.
Who Should Use This Product?
- Professional Investors: Develop comprehensive and accurate valuation models for assessing investments in Territorial Bancorp Inc. (TBNK).
- Corporate Finance Teams: Evaluate valuation scenarios to inform strategic decisions within the organization.
- Consultants and Advisors: Offer clients precise valuation insights for Territorial Bancorp Inc. (TBNK) stock.
- Students and Educators: Utilize real-time data to enhance financial modeling skills in academic settings.
- Banking Enthusiasts: Gain insights into how regional banks like Territorial Bancorp Inc. (TBNK) are valued in the financial landscape.
What the Template Contains
- Pre-Filled DCF Model: Territorial Bancorp Inc.'s (TBNK) financial data preloaded for immediate use.
- WACC Calculator: Detailed calculations for Weighted Average Cost of Capital tailored for Territorial Bancorp Inc. (TBNK).
- Financial Ratios: Assess Territorial Bancorp Inc.'s (TBNK) profitability, leverage, and efficiency metrics.
- Editable Inputs: Modify assumptions such as growth rates, margins, and CAPEX to align with your scenarios for Territorial Bancorp Inc. (TBNK).
- Financial Statements: Access annual and quarterly reports for in-depth analysis of Territorial Bancorp Inc. (TBNK).
- Interactive Dashboard: Effortlessly visualize key valuation metrics and results for Territorial Bancorp Inc. (TBNK).
Disclaimer
All information, articles, and product details provided on this website are for general informational and educational purposes only. We do not claim any ownership over, nor do we intend to infringe upon, any trademarks, copyrights, logos, brand names, or other intellectual property mentioned or depicted on this site. Such intellectual property remains the property of its respective owners, and any references here are made solely for identification or informational purposes, without implying any affiliation, endorsement, or partnership.
We make no representations or warranties, express or implied, regarding the accuracy, completeness, or suitability of any content or products presented. Nothing on this website should be construed as legal, tax, investment, financial, medical, or other professional advice. In addition, no part of this site—including articles or product references—constitutes a solicitation, recommendation, endorsement, advertisement, or offer to buy or sell any securities, franchises, or other financial instruments, particularly in jurisdictions where such activity would be unlawful.
All content is of a general nature and may not address the specific circumstances of any individual or entity. It is not a substitute for professional advice or services. Any actions you take based on the information provided here are strictly at your own risk. You accept full responsibility for any decisions or outcomes arising from your use of this website and agree to release us from any liability in connection with your use of, or reliance upon, the content or products found herein.