
|
Toast, Inc. (TOST) DCF -Bewertung |
Fully Editable: Tailor To Your Needs In Excel Or Sheets
Professional Design: Trusted, Industry-Standard Templates
Investor-Approved Valuation Models
MAC/PC Compatible, Fully Unlocked
No Expertise Is Needed; Easy To Follow
Toast, Inc. (TOST) Bundle
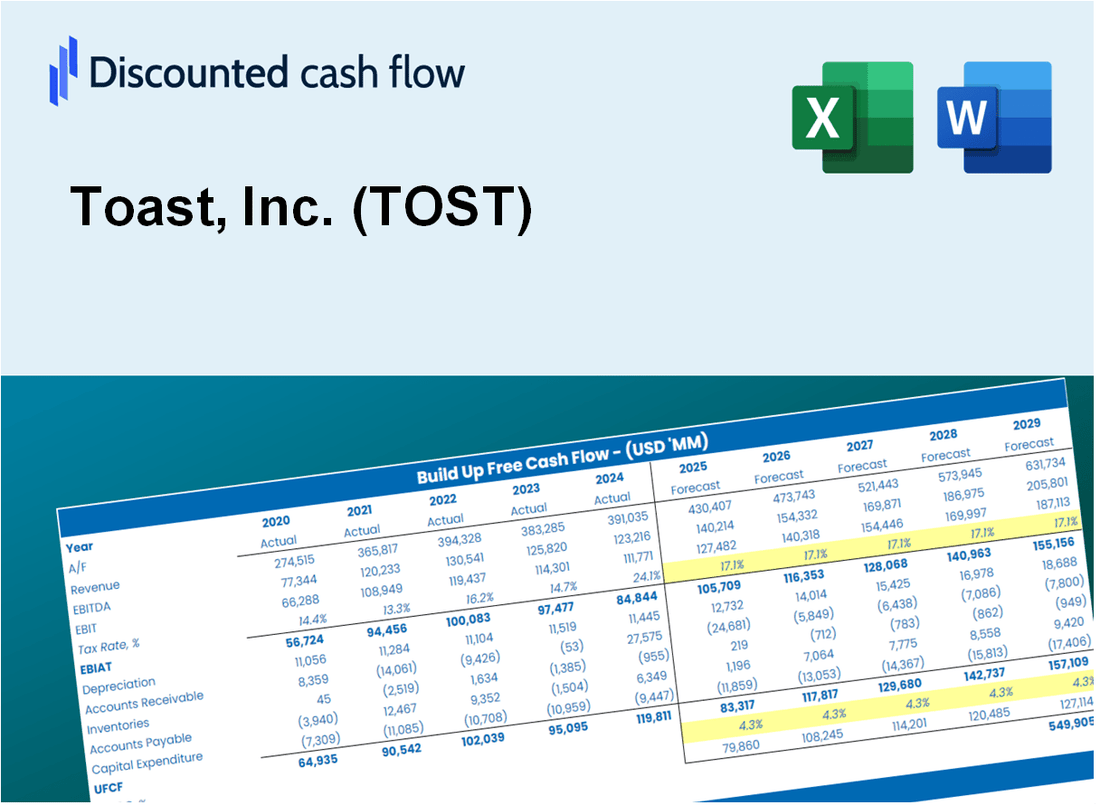
Egal, ob Sie ein Investor oder Analyst sind, dieser DCF-Taschenrechner Toast, Inc. (TOST) ist Ihre Anlaufstelle für eine genaue Bewertung. Es wird mit echten Daten von Toast, Inc. vorinstalliert, sodass Sie Prognosen anpassen und die Effekte in Echtzeit beobachten können.
What You Will Get
- Real Toast Data: Preloaded financials – from revenue to EBIT – based on actual and projected figures.
- Full Customization: Adjust all critical parameters (yellow cells) like WACC, growth %, and tax rates.
- Instant Valuation Updates: Automatic recalculations to analyze the impact of changes on Toast's fair value.
- Versatile Excel Template: Tailored for quick edits, scenario testing, and detailed projections.
- Time-Saving and Accurate: Skip building models from scratch while maintaining precision and flexibility.
Key Features
- Customizable Financial Inputs: Adjust essential variables such as revenue growth, EBITDA %, and capital investments.
- Instant DCF Valuation: Quickly computes intrinsic value, NPV, and additional metrics with ease.
- High-Precision Accuracy: Leverages Toast, Inc.'s (TOST) actual financial data for credible valuation results.
- Effortless Scenario Analysis: Evaluate various assumptions and analyze results without hassle.
- Efficiency Booster: Streamline the valuation process by avoiding the creation of intricate models from the ground up.
How It Works
- Download the Template: Gain immediate access to the Excel-based TOST DCF Calculator.
- Input Your Assumptions: Modify the yellow-highlighted cells for growth rates, WACC, margins, and other parameters.
- Instant Calculations: The model automatically recalculates Toast, Inc.'s intrinsic value.
- Test Scenarios: Explore various assumptions to assess potential changes in valuation.
- Analyze and Decide: Leverage the results to inform your investment or financial decisions.
Why Choose This Calculator for Toast, Inc. (TOST)?
- User-Friendly Interface: Perfectly tailored for both novices and seasoned professionals.
- Customizable Inputs: Adjust parameters effortlessly to suit your financial analysis.
- Real-Time Adjustments: Watch Toast’s valuation update instantly as you change inputs.
- Pre-Loaded Data: Comes with Toast’s actual financial metrics for immediate evaluation.
- Favored by Experts: A reliable tool for investors and analysts making strategic choices.
Who Should Use Toast, Inc. (TOST)?
- Restaurant Owners: Streamline operations with an all-in-one restaurant management platform.
- Financial Managers: Analyze sales data and optimize financial performance effortlessly.
- Consultants: Tailor the system for client needs and enhance their operational efficiency.
- Culinary Entrepreneurs: Gain insights into customer preferences and improve menu offerings.
- Students and Educators: Explore real-world applications of technology in the food service industry.
What the Template Contains
- Historical Data: Includes Toast, Inc.’s (TOST) past financials and baseline forecasts.
- DCF and Levered DCF Models: Detailed templates to calculate Toast, Inc.’s (TOST) intrinsic value.
- WACC Sheet: Pre-built calculations for Weighted Average Cost of Capital.
- Editable Inputs: Modify key drivers like growth rates, EBITDA %, and CAPEX assumptions.
- Quarterly and Annual Statements: A complete breakdown of Toast, Inc.’s (TOST) financials.
- Interactive Dashboard: Visualize valuation results and projections dynamically.
Disclaimer
All information, articles, and product details provided on this website are for general informational and educational purposes only. We do not claim any ownership over, nor do we intend to infringe upon, any trademarks, copyrights, logos, brand names, or other intellectual property mentioned or depicted on this site. Such intellectual property remains the property of its respective owners, and any references here are made solely for identification or informational purposes, without implying any affiliation, endorsement, or partnership.
We make no representations or warranties, express or implied, regarding the accuracy, completeness, or suitability of any content or products presented. Nothing on this website should be construed as legal, tax, investment, financial, medical, or other professional advice. In addition, no part of this site—including articles or product references—constitutes a solicitation, recommendation, endorsement, advertisement, or offer to buy or sell any securities, franchises, or other financial instruments, particularly in jurisdictions where such activity would be unlawful.
All content is of a general nature and may not address the specific circumstances of any individual or entity. It is not a substitute for professional advice or services. Any actions you take based on the information provided here are strictly at your own risk. You accept full responsibility for any decisions or outcomes arising from your use of this website and agree to release us from any liability in connection with your use of, or reliance upon, the content or products found herein.